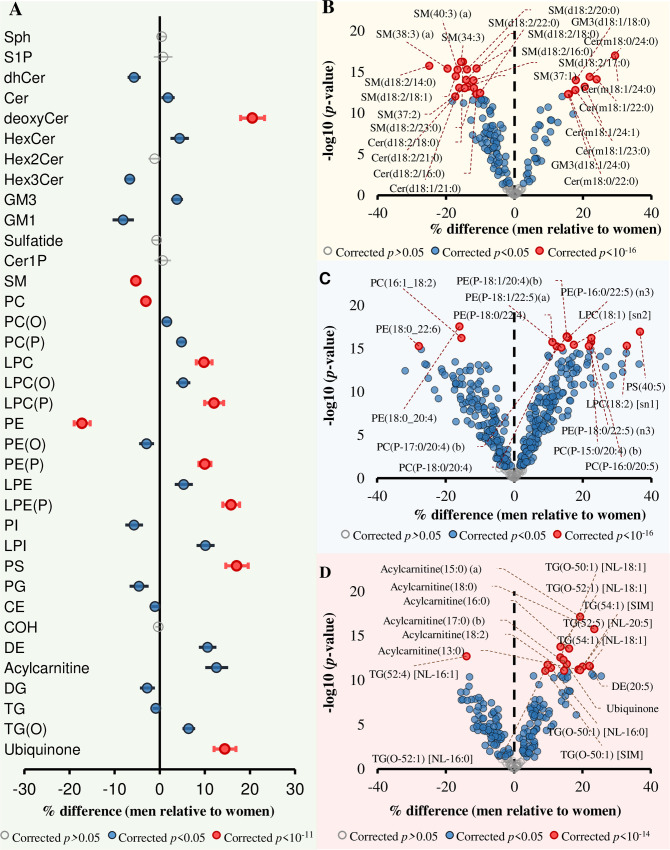
Fig 1. Associations between sex and lipid classes, subclasses, and species.
Linear regression analysis between sex and log-transformed concentrations of each lipid species was performed adjusting for age, BMI, total cholesterol, HDL-C, and triglycerides (n = 10,339). The beta coefficients were converted to percentage difference for men relative to women. (A) Associations between sex and lipid classes/subclasses. (B) Associations between sex and sphingolipid species. (C) Associations between sex and phospholipid species. (D) Associations between sex and glycerolipid and fatty-acyl species. Grey circles show nonsignificant classes/subclasses and species, blue circles show classes/subclasses and species with corrected p < 0.05, and pink circles represent the most significantly associated classes/subclasses and species. Whiskers represent 95% confidence intervals. The underlying data can be found in S1 Data. BMI, body mass index; CE, cholesteryl ester; Cer, ceramide; Cer-1-P, ceramide-1-phosphate; COH, free cholesterol; DE, dehydrocholesterol; deoxyCer, deoxyceramide; DG, diacylglycerol; dhCer, dihydroceramide; GM1, GM1 ganglioside; GM3, GM3 ganglioside; HDL-C, high-density lipoprotein cholesterol; HexCer, monohexosylceramide; Hex2Cer, dihexosylceramide; Hex3Cer, trihexosylceramide; LPC, lysophosphatidylcholine; LPC(O), lysoalkylphosphatidylcholine; LPC(P), lysoalkenylphosphatidylcholine; LPE, lysophosphatidylethanolamine; LPE(P), lysoalkenylphosphatidylethanolamine; LPI, lysophosphatidylinositol; NL, neutral loss; PC, phosphatidylcholine; PC(O), alkylphosphatidylcholine; PC(P), alkenylphosphatidylcholine; PE, phosphatidylethanolamine; PE(O), alkylphosphatidylethanolamine; PE(P), alkenylphosphatidylethanolamine; PG, phosphatidylglycerol; PI, phosphatidylinositol; SM, sphingomyelin; sn, stereospecifically numbered; Sph, sphingosine; S-1-P, sphingosine-1-phosphate; TG, triacylglycerol; TG(O), alkyl-diacylglycerol.

