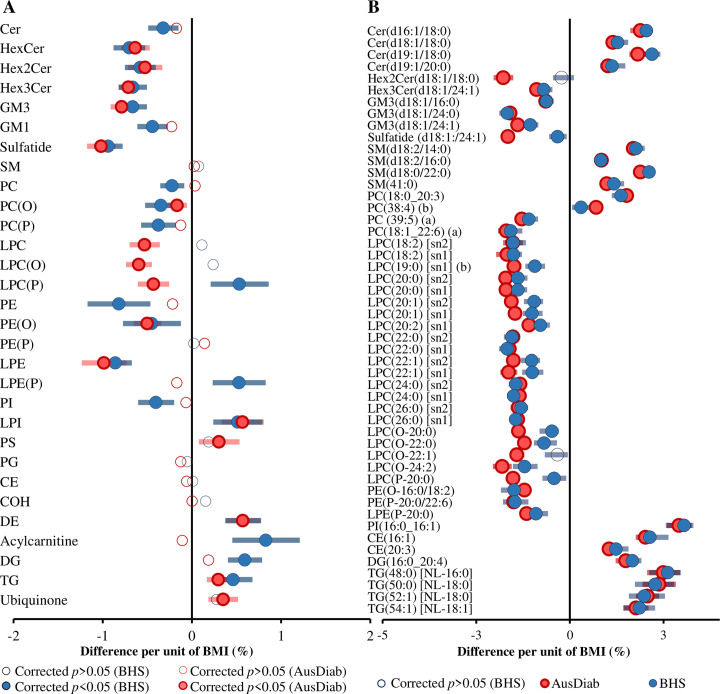
Fig 8. Validation of the association between BMI and plasma lipid classes/subclasses and species.
(A) Linear regression analysis between BMI and log-transformed lipid class concentrations was performed on 10,339 AusDiab participants and 4,097 Busselton participants. (B) The same analyses were performed at the lipid species level, and the 50 most significant species in the AusDiab were selected based on lowest corrected p-values. The analyses were adjusted for age, sex, total cholesterol, HDL-C, and triglycerides. Pink and blue closed circles show lipid species/classes associated with BMI in AusDiab and Busselton cohort, respectively (p < 0.05). Open circles represent nonsignificant associations (corrected p > 0.05). Error bars represent the 95% confidence intervals. See S1 Data for the underlying data. AusDiab, Australian Diabetes, Obesity and Lifestyle Study; BMI, body mass index; CE, cholesteryl ester; Cer, ceramide; Cer-1-P, ceramide-1-phosphate; COH, free cholesterol; DE, dehydrocholesterol; deoxyCer, deoxyceramide; DG, diacylglycerol; dhCer, dihydroceramide; GM1, GM1 ganglioside; GM3, GM3 ganglioside; HDL-C, high-density lipoprotein cholesterol; HexCer, monohexosylceramide; Hex2Cer, dihexosylceramide; Hex3Cer, trihexosylceramide; LPC, lysophosphatidylcholine; LPC(O), lysoalkylphosphatidylcholine; LPC(P), lysoalkenylphosphatidycholine; LPE, lysophosphatidylethanolamine; LPE(P), lysoalkenylphosphatidylethanolamine; LPI, lysophosphatidylinositol; NL, neutral loss; PC, phosphatidylcholine; PC(O), alkylphosphatidylcholine; PC(P), alkenylphosphatidylcholine; PE, phosphatidylethanolamine; PE(O), alkylphosphatidylethanomine; PE(P), alkenylphosphatidylethanolamine; PG, phosphatidylglycerol; PI, phosphatidylinositol; PS, phosphatidylserine; SM, sphingomyelin; sn, stereospecifically numbered; TG, triacylglycerol.

