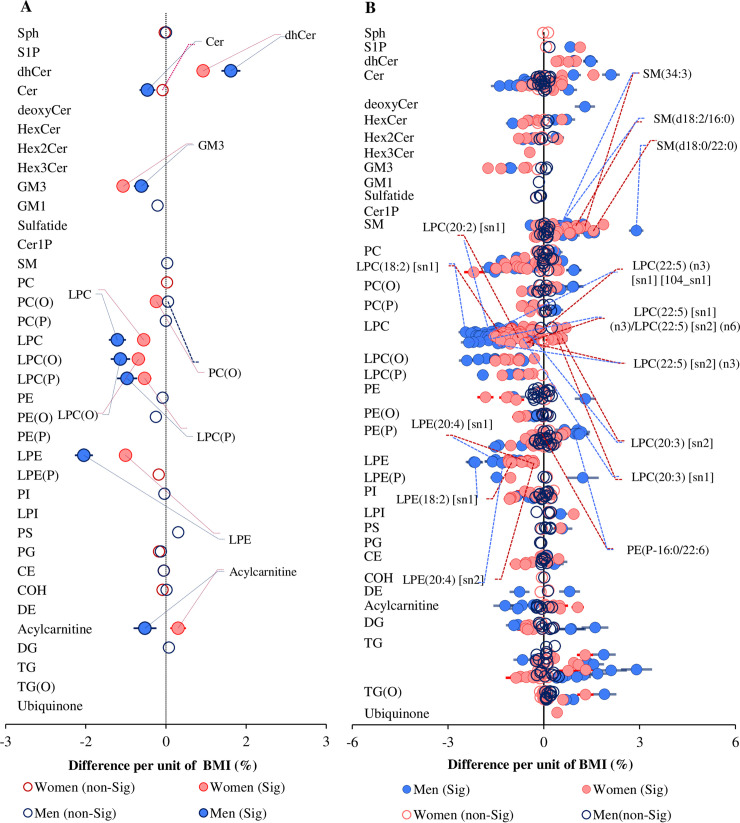
Fig 9. Sex-specific association between BMI and plasma lipid classes and species.
(A) Linear regression analysis between BMI and log-transformed lipid class concentrations on 10,339 participants (men = 4,654 and women = 5,685) adjusting for age, sex, total cholesterol, HDL-C, and triglycerides and including a sex × BMI interaction term. (B) Linear regression analyses between BMI and log-transformed lipid species concentrations including sex interaction, adjusting for age, sex, total cholesterol, HDL-C, and triglycerides. Associations with lipid species that showed a significant sex interaction (corrected p < 0.05) were plotted separately for women (pink) and men (blue). Closed circles show significant associations (corrected p < 0.05). Open circles show corrected p > 0.05. Error bars represent 95% confidence intervals. See S1 Data for the underlying data. BMI, body mass index; CE, cholesteryl ester; Cer, ceramide; Cer-1-P, ceramide-1-phosphate; COH, free cholesterol; DE, dehydrocholesterol; deoxyCer, deoxyceramide; DG, diacylglycerol; dhCer, dihydroceramide; GM1, GM1 ganglioside; GM3, GM3 ganglioside; HDL-C, high-density lipoprotein cholesterol; HexCer, monohexosylceramide; Hex2Cer, dihexosylceramide; Hex3Cer, trihexosylceramide; LPC, lysophosphatidylcholine; LPC(O), lysoalkylphosphatidylcholine; LPC(P), lysoalkenylphosphatidylcholine; LPE, lysophosphatidylethanolamine; LPE(P), lysoalkenylphosphatidylethanolamine; LPI, lysophosphatidylinositol; PC, phosphatidylcholine; PC(O), alkylphosphatidylcholine; PC(P), alkenylphosphatidylcholine; PE, phosphatidylethanolamine; PE(O), alkylphosphatidylethanolamine; PE(P), alkenylphosphatidylethanolamine; PG, phosphatidylglycerol; PI, phosphatidylinositol; PS, phosphatidylserine; SM, sphingomyelin; sn, stereospecifically numbered; Sph, sphingosine; S-1-P, sphingosine-1-phosphate; TG, triacylglycerol; TG(O), alkyl-diacylglycerol.

