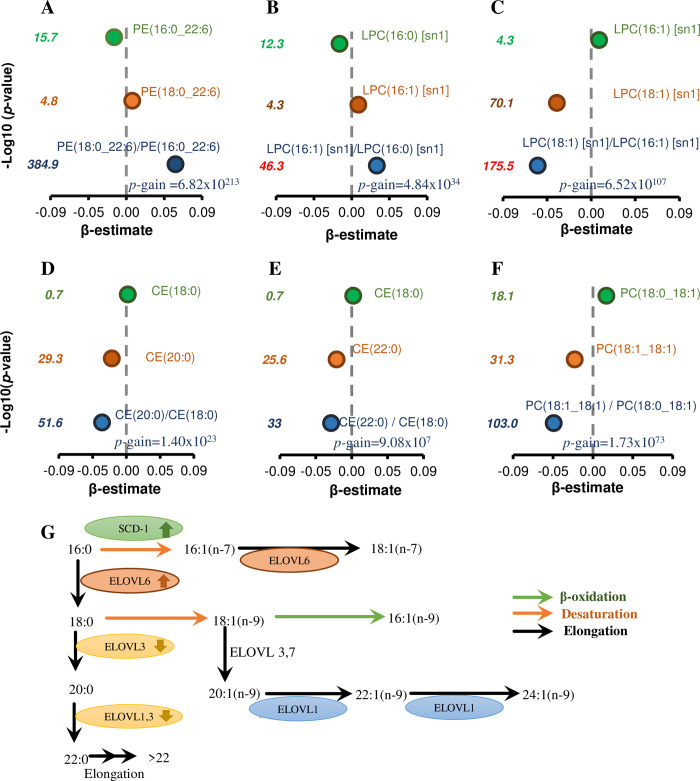
Fig 10. Plasma fatty acid ratios and enzyme pathways associated with BMI.
A linear regression adjusted for age, sex, total cholesterol, HDL-C, and triglycerides was performed between individual lipid species or lipid ratios and BMI (panels A–F). The strength of associations with ratios relative to individual lipid species is indicated by p-gain values. (G) The de novo monounsaturated fatty acid pathway in mammals. The proposed increase or decrease in enzyme activities with increasing BMI is shown by arrows. BMI, body mass index; CE, cholesteryl ester; ELOVL, elongation of very long chain fatty acids protein; HDL-C, high-density lipoprotein cholesterol; LPC, lysophosphatidylcholine; PC, phosphatidylcholine; PE, phosphatidylethanolamine; SCD-1, stearoyl CoA desaturase 1; sn, stereospecifically numbered

