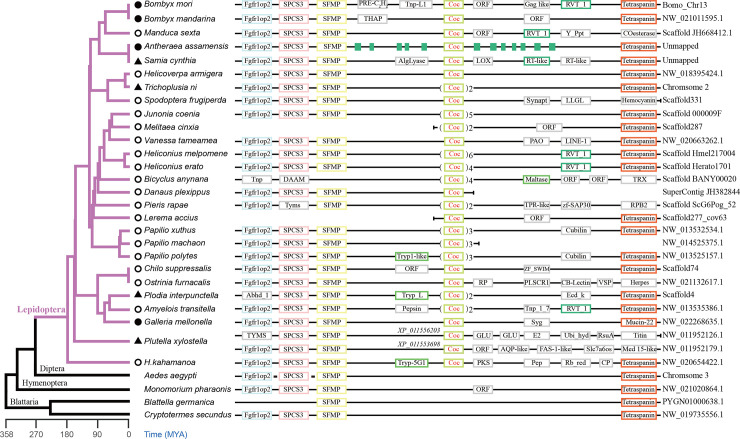
Fig 2. Syntenic analysis of cocoonase genes in insects.
Syntenic analysis of cocoonase genes in lepidopteran species marked with purple clades and three outgroups with available linkage information. Orthologous genes are identified by a border with same color, and non-homologous genes and genes without functional annotation are indicated by ORFs and marked by a gray border. The green rectangles represent predicted transposons. The Arabic numerals in the figure showed the copy number of the cocoonase gene in each species. The two cocoonase genes of Plutella xylostella were located at different scaffold, and the IDs of the two enzymes were shown next to the gene on the scaffold diagram.

