Figure 1.

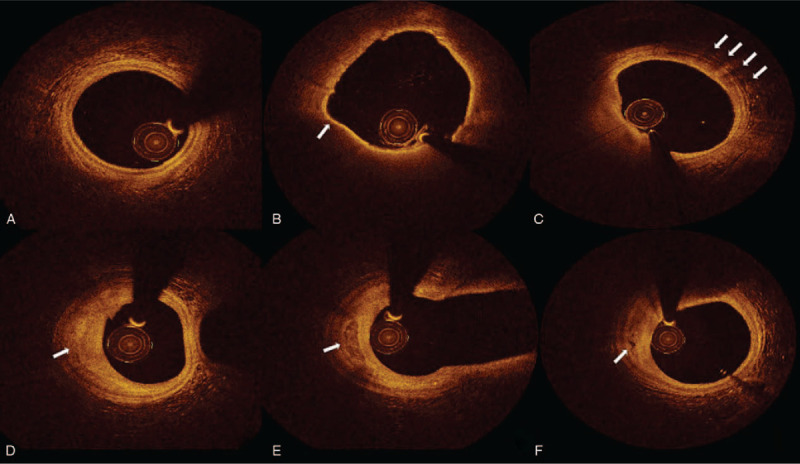
Coronary plaques of OCT images. A. Normal vascular structure B. Thin cap fibroatheroma and arrow showed the thickness of fibrosis cap was 60 μm C. Macrophages infiltration D. Fibrosis plaque E. Calcium plaque F. Microchannel.

Coronary plaques of OCT images. A. Normal vascular structure B. Thin cap fibroatheroma and arrow showed the thickness of fibrosis cap was 60 μm C. Macrophages infiltration D. Fibrosis plaque E. Calcium plaque F. Microchannel.