Figure 2.

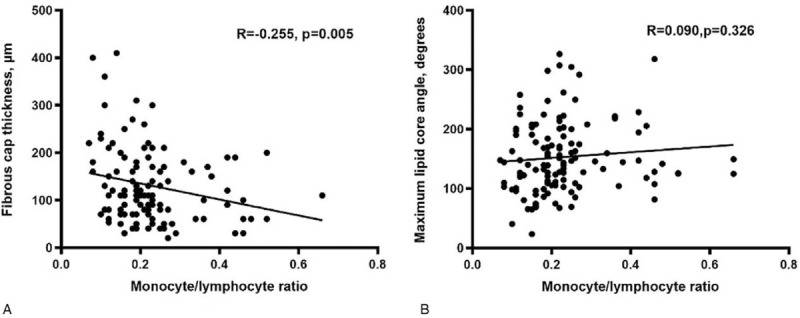
Correlation analysis of monocyte/lymphocyte ratio (MLR) and relative plaque components of the non-culprit plaque assessed by optical coherence tomography. (A) Fibrous cap thickness, (B) Maximum lipid core angle.

Correlation analysis of monocyte/lymphocyte ratio (MLR) and relative plaque components of the non-culprit plaque assessed by optical coherence tomography. (A) Fibrous cap thickness, (B) Maximum lipid core angle.