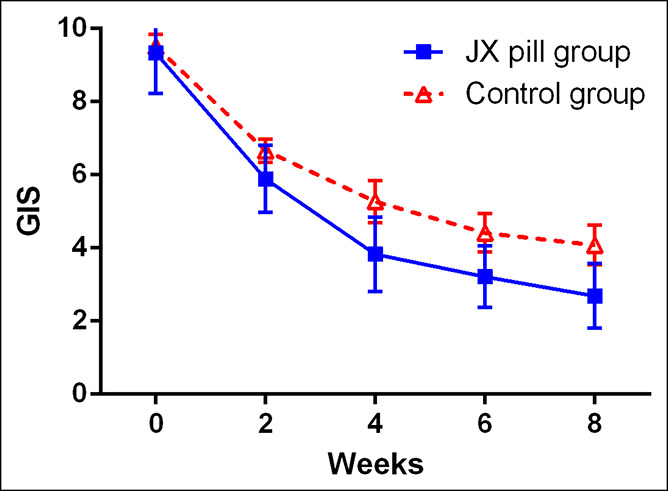
Figure 2.

GIS during the 8-week intervention period. The GIS, measured at baseline, week 2, week 4, week 6, and week 8, is shown for the JX pill group and the control group. The GIS ranges from 1 to 40, with higher scores indicating more severe symptoms and lower scores indicating an improvement in outcomes. The values shown are unadjusted mean; I bars indicate 95% confidence intervals. GIS, Gastrointestinal Symptom Score; JX, Jiawei Xiaoyao.
