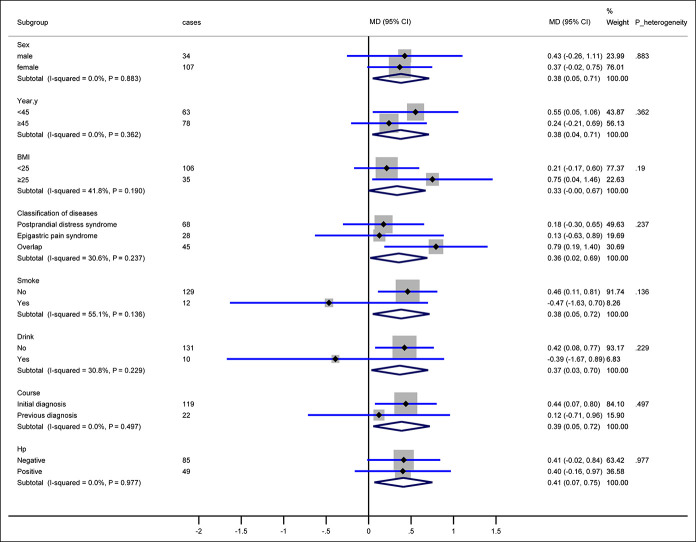
Figure 3.
Changes from baseline to 4 weeks in the GIS by subgroups. The size of the data markers indicates the size of the standard mean difference of the GIS from baseline to week 4. P values were calculated by interaction parameters in the general linear model. BMI, body mass index; CI, confidence intervals; GIS, Gastrointestinal Symptom Score; Hp, H.pylori; MD, mean difference.

