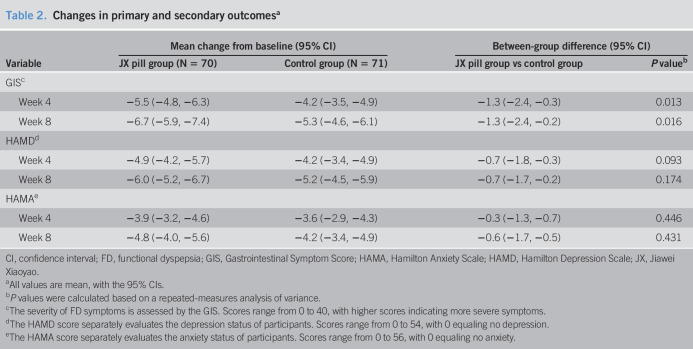
Table 2.
Changes in primary and secondary outcomesa
| Variable | Mean change from baseline (95% CI) | Between-group difference (95% CI) | ||
| JX pill group (N = 70) | Control group (N = 71) | JX pill group vs control group | P valueb | |
| GISc | ||||
| Week 4 | −5.5 (−4.8, −6.3) | −4.2 (−3.5, −4.9) | −1.3 (−2.4, −0.3) | 0.013 |
| Week 8 | −6.7 (−5.9, −7.4) | −5.3 (−4.6, −6.1) | −1.3 (−2.4, −0.2) | 0.016 |
| HAMDd | ||||
| Week 4 | −4.9 (−4.2, −5.7) | −4.2 (−3.4, −4.9) | −0.7 (−1.8, −0.3) | 0.093 |
| Week 8 | −6.0 (−5.2, −6.7) | −5.2 (−4.5, −5.9) | −0.7 (−1.7, −0.2) | 0.174 |
| HAMAe | ||||
| Week 4 | −3.9 (−3.2, −4.6) | −3.6 (−2.9, −4.3) | −0.3 (−1.3, −0.7) | 0.446 |
| Week 8 | −4.8 (−4.0, −5.6) | −4.2 (−3.4, −4.9) | −0.6 (−1.7, −0.5) | 0.431 |
CI, confidence interval; FD, functional dyspepsia; GIS, Gastrointestinal Symptom Score; HAMA, Hamilton Anxiety Scale; HAMD, Hamilton Depression Scale; JX, Jiawei Xiaoyao.
All values are mean, with the 95% CIs.
P values were calculated based on a repeated-measures analysis of variance.
The severity of FD symptoms is assessed by the GIS. Scores range from 0 to 40, with higher scores indicating more severe symptoms.
The HAMD score separately evaluates the depression status of participants. Scores range from 0 to 54, with 0 equaling no depression.
The HAMA score separately evaluates the anxiety status of participants. Scores range from 0 to 56, with 0 equaling no anxiety.

