
Figure 4.
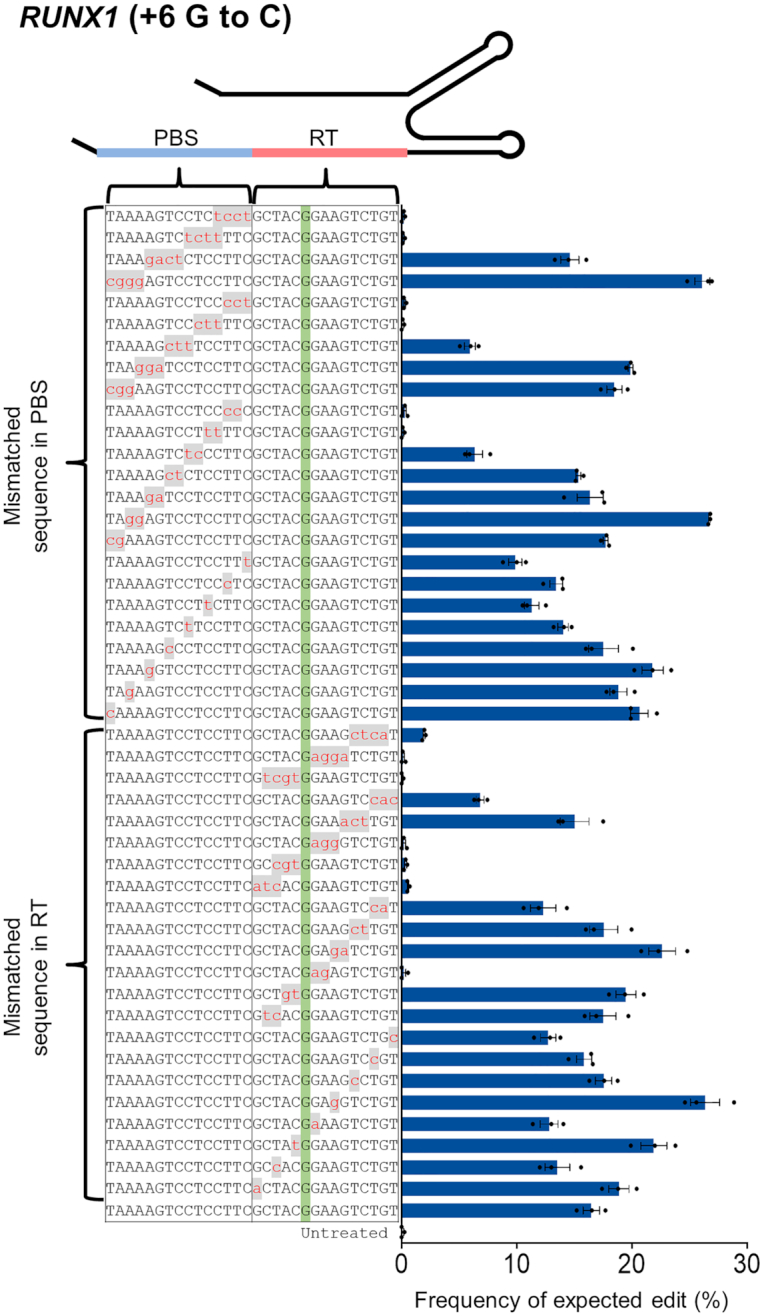
Tolerance of PE2 for mismatches in the PBS or RT template region of the pegRNA and enhanced specificity with engineered PE2. Frequency of targeted edits induced by PE2 using pegRNAs containing one to four mismatched nucleotides in the PBS or RT template. The PAM is shown in blue, and the mismatched nucleotides are shown in red lowercase letters on a gray background. Error bars indicate the s.e.m. (three biologically independent samples).