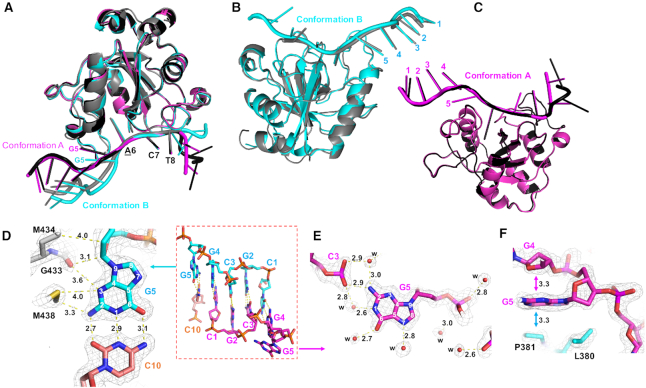
Figure 3.
Two YTH-bound DNA conformations. (A) Superimposition of four complexes, A and B (black and dark gray) in space group C2 (PDB: 6WE9) and A and B (magenta and cyan) in space group P21 (PDB: 6WEA). (B) Superimposition of two B complexes in space groups C2 (gray) and P21 (cyan). (C) Superimposition of two A complexes in space groups C2 (black) and P21 (magenta). (D) Guanine G5 of complex B involves in base pairing. (E, F) Guanine G5 of complex A involves in intra-molecular interaction and protein–DNA interaction. The omit Fo – Fc electron density map (light grey) contoured at 4σ above the mean. Panels D–F are depicted from the structure (PDB: 6WEA).

