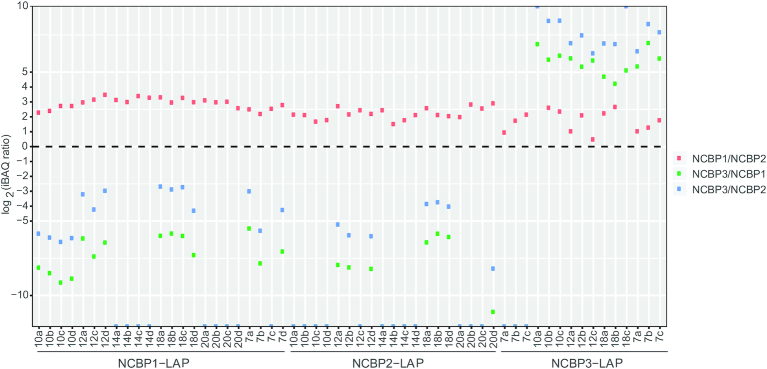
Figure 4.
Ratios of NCBPs in individual IPs. The log2 ratios of the NCBP iBAQ intensities were calculated for each IP experiment as a proxy for relative copy number—shown as NCBP1/NCBP2 (red), NCBP3/NCBP1 (green), NCBP3/NCBP2 (blue). NCBP1 has the highest copy number in NCBP1-LAP IPs and NCBP2-LAP IPs, while NCBP3 has the highest copy number in NCBP3-LAP IPs.

