Figure 1.

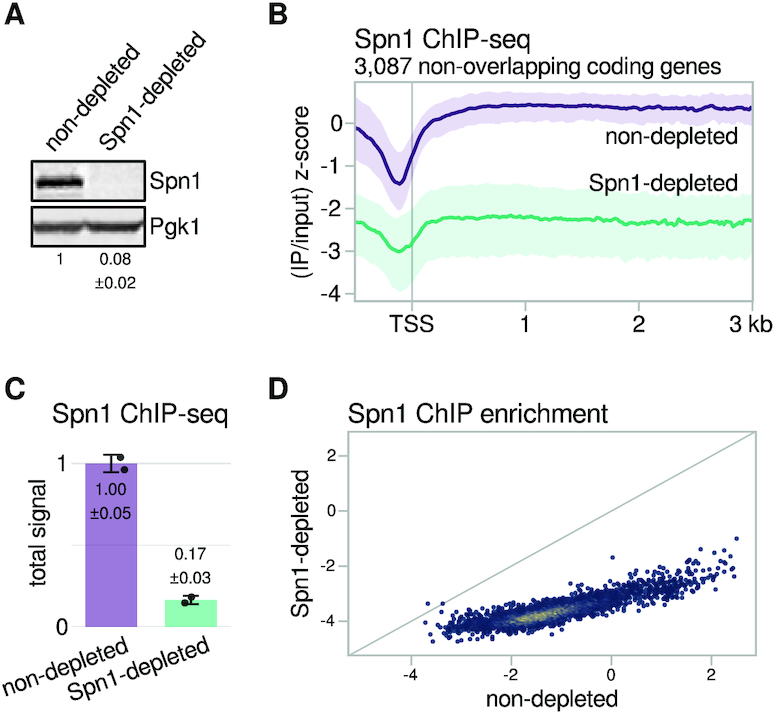
An auxin-inducible degron efficiently depletes Spn1 from chromatin. (A) Western blot showing levels of Spn1 protein in the Spn1 degron strain after 90 min of treatment with DMSO (non-depleted) or 25 μM IAA (Spn1-depleted). Pgk1 was used as a loading control. The values below the blots indicate the mean ± standard deviation of normalized Spn1 abundance quantified from two biological replicates. (B) Average Spn1 ChIP enrichment over 3087 non-overlapping, verified coding genes aligned by TSS in non-depleted and Spn1-depleted conditions. For each gene, the spike-in normalized ratio of IP over input signal is standardized to the mean and standard deviation of the non-depleted signal over the region, resulting in standard scores that allow genes with varied expression levels to be compared on the same scale. The solid line and shading are the median and interquartile range of the mean standard score over two replicates. (C) Bar plot showing total levels of Spn1 on chromatin in non-depleted and Spn1-depleted conditions, estimated from ChIP-seq spike-in normalization factors (see Materials and Methods). The values and error bars for each condition indicate the mean ± standard deviation of two replicates. (D) Scatterplot showing Spn1 ChIP enrichment in Spn1-depleted versus non-depleted conditions for 5091 verified coding genes. Enrichment values are the relative log2 enrichment of IP over input.
