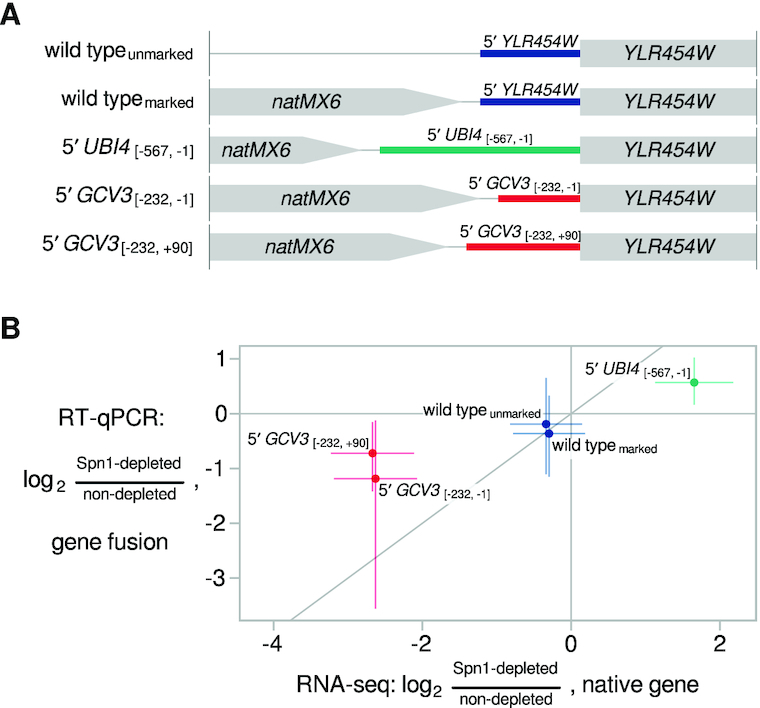
Figure 3.

5′ regulatory regions influence Spn1-dependent regulation of transcript levels. (A) Schematic of gene fusions in which the 5′ regulatory regions of two Spn1-dependent genes replaced the 5′ regulatory region of the YLR454W gene. The nucleotide coordinates of the native UBI4 and GCV3 regulatory regions are shown, relative to the start of the coding sequence (19,45). All fusions were made in the Spn1 degron background. (B) Scatterplot summarizing results of the 5′ regulatory region replacement experiment. The y-axis shows RT-qPCR measurements of the change in YLR454W transcript abundance upon Spn1 depletion in the gene fusion strains. The x-axis shows RNA-seq measurements of the change in transcript abundance upon Spn1 depletion for the native gene whose 5' regulatory region was used to drive YLR454W expression in the fusion strains. The line y = x is drawn for comparison. Error bars indicate 95% confidence intervals, and points corresponding to the same native gene are slightly jittered by adding a small amount of random noise along the x-axis for clarity.
