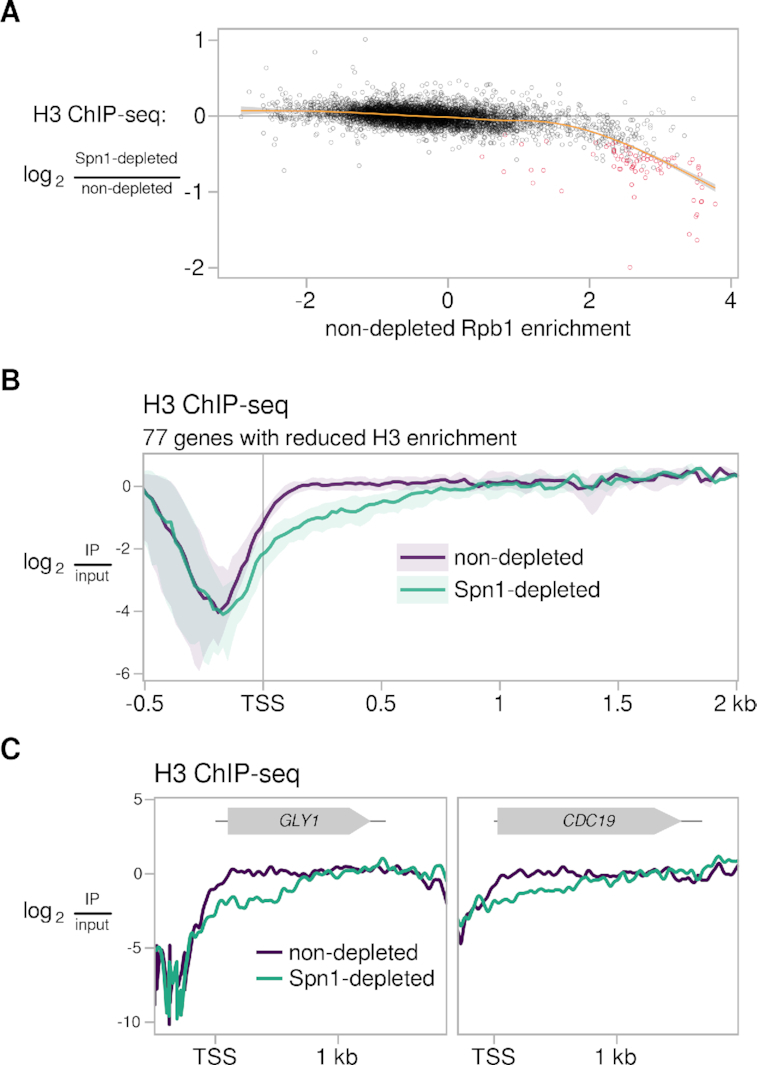
Figure 5.

Histone H3 levels are reduced at the 5′ end of a small set of genes after Spn1 depletion. (A) Scatterplot showing change in H3 enrichment upon Spn1 depletion versus non-depleted Rpb1 enrichment for 5091 verified coding genes. Rpb1 enrichment values are the relative log2 enrichment of IP over input. Genes with significant decreases in H3 enrichment are colored red, and a cubic regression spline is overlaid. (B) Average H3 ChIP enrichment in non-depleted and Spn1-depleted conditions for the 77 genes with significantly decreased H3 ChIP enrichment over the entire gene upon Spn1 depletion. The solid line and shading are the median and interquartile range of the mean enrichment over four replicates. (C) H3 ChIP enrichment in non-depleted and Spn1-depleted conditions for two genes with significantly decreased H3 ChIP enrichment upon Spn1 depletion. The mean enrichment over four replicates is shown.
