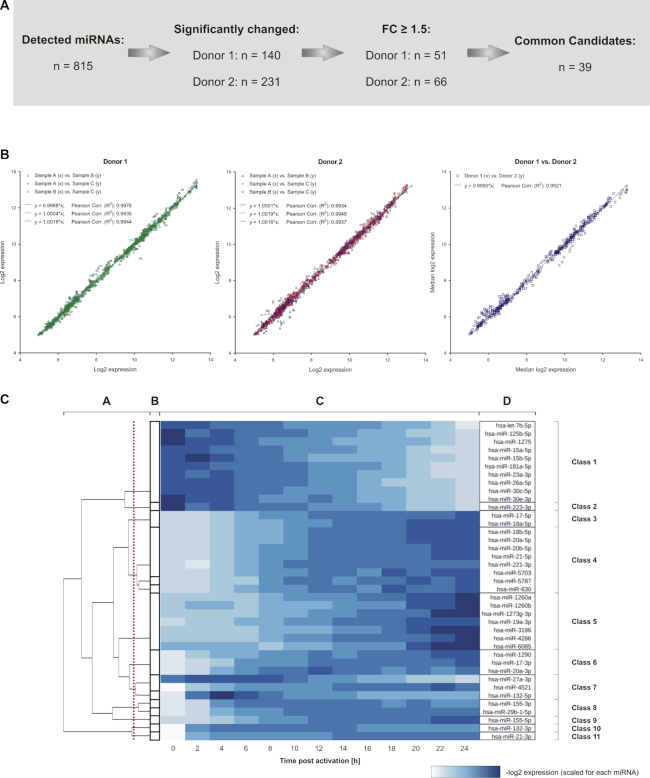
Figure 2.
Overview on the detected miRNA expression changes within early CD4+ T cell activation. (A) Overview on the number of miRNAs that were detected by time-resolved expression profiling. Significantly changed miRNAs were identified for each donor. Out of these, 39 miRNAs showed a median fold change larger 1.5 in both donors and were defined as potential candidates for the general regulation of early T cell activation signaling. (B) The identified 39 miRNA candidates showed a high correlation for a donor-wise comparison between the time-resolved miRNA expression data (log2) of the three separate T cell activation reactions per time point (denoted as A, B and C) and for the comparison between the median results of the two donors (n = 507 comparisons each). Regression equations and coefficients (R2) are indicated. (C) Grouping of the 39 miRNAs into classes of similar time-resolved expression patterns The analysis was based on the median result of all RNA samples from donor 1 and 2 (n = 6) per time point. Clusters were calculated using the ILP formulation by Grötschel and Wakabayashi in combination with a hierarchical clustering (B and A). The red line indicates the cut off, used to create the final clustering. The heatmap (C) shows scaled log2 expression values for each miRNA with the resulting classes of time-resolved expression patterns (D).

