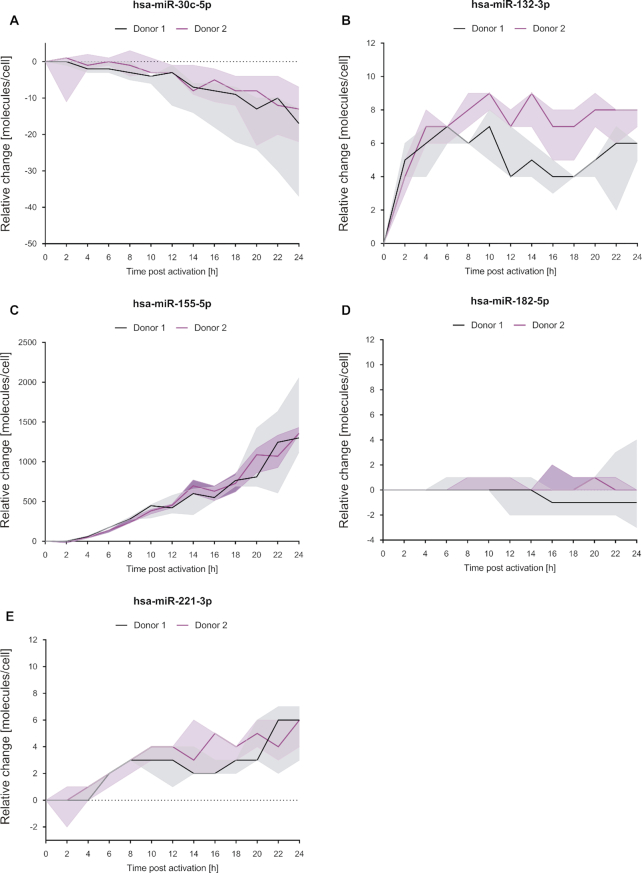
Figure 4.
Changes of miRNA molecules per cell upon activation of CD4+ T cells. MiRNA expression changes [molecules/cell] related to the 0 h time-point (non-activated cells) were exemplary determined for selected miRNAs by the application of corresponding microarray calibration curves to the time-resolved expression data. Results of the represented miRNAs are shown as median (line) of the three separate T cell activation reactions per time point and donor. The expressional ranges of the three activation reactions are shown for each time point by filled areas.

