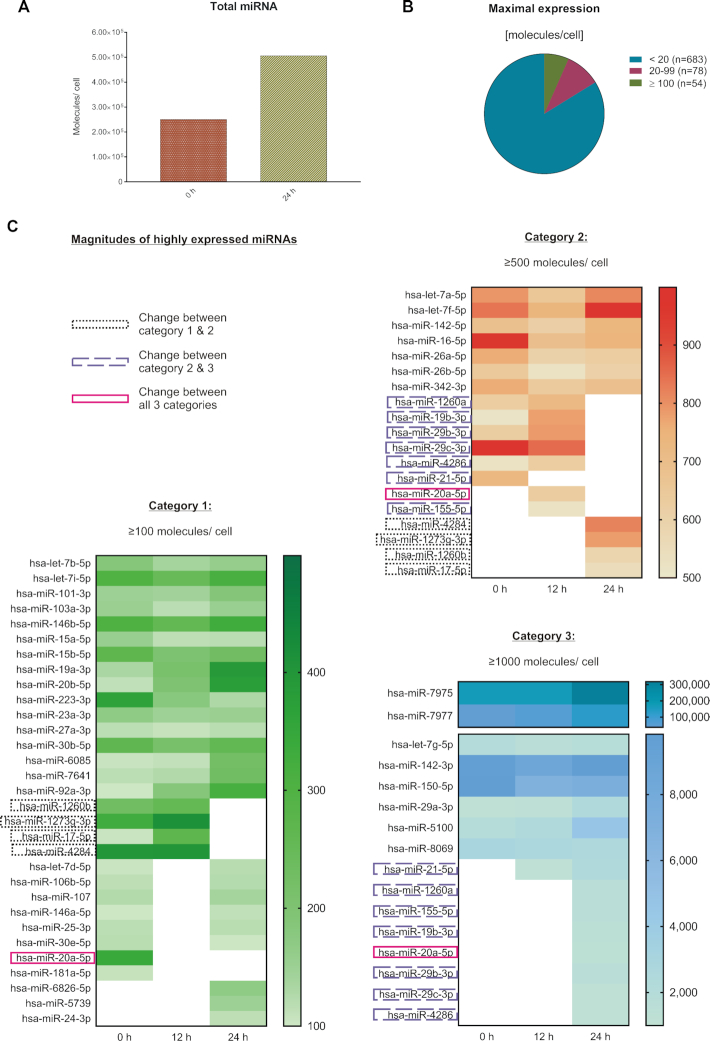
Figure 5.
Quantification of absolute miRNA molecules per cell in context with CD4+ T cell activation. Absolute miRNA expression [molecules/cell] was determined for all detected miRNAs by the application of a microarray calibration curve to the time-resolved expression data. The quantitative and time-resolved miRNA patterns were evaluated based on the median result of all RNA samples from donors 1 and 2 (n = 6 per time point). (A) Total miRNA expression was determined by the sum of all detected miRNAs at 0 and 24 h after activation (n = 815). (B) The maximum expression of each miRNA was determined for the total 24 h time frame. (C) The highest expressed miRNAs were compared between the 0, 12 and 24 h time points. The increase of miR-451a was during 7–8 h after activation and is therefore not represented by the displayed time points.

