Figure 6.
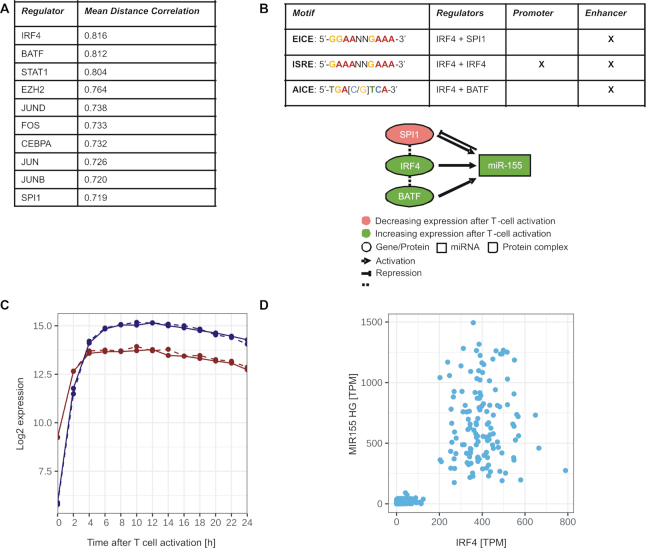
Potential upstream regulators of miR-155 in context with T cell activation. (A) Top 10 list of potential regulators of MIR155HG gene sorted by their mean distance correlation on all investigated data sets. (B) Network of miR-155 and its potential upstream regulators IRF4, SPI1, BATF and annotation of corresponding binding motifs of their complexes within the regulatory regions of MIR155HG gene. (C) Time-resolved expression patterns (Median results of the mRNA data) of IRF4 and pre-miR-155 (MIR155HG) within 24 h of CD4+ T cell activation. (D) Scatter plot between the expression (TPM: transcripts per million) of IRF4 and MIR155HG in the GTEx data set.

