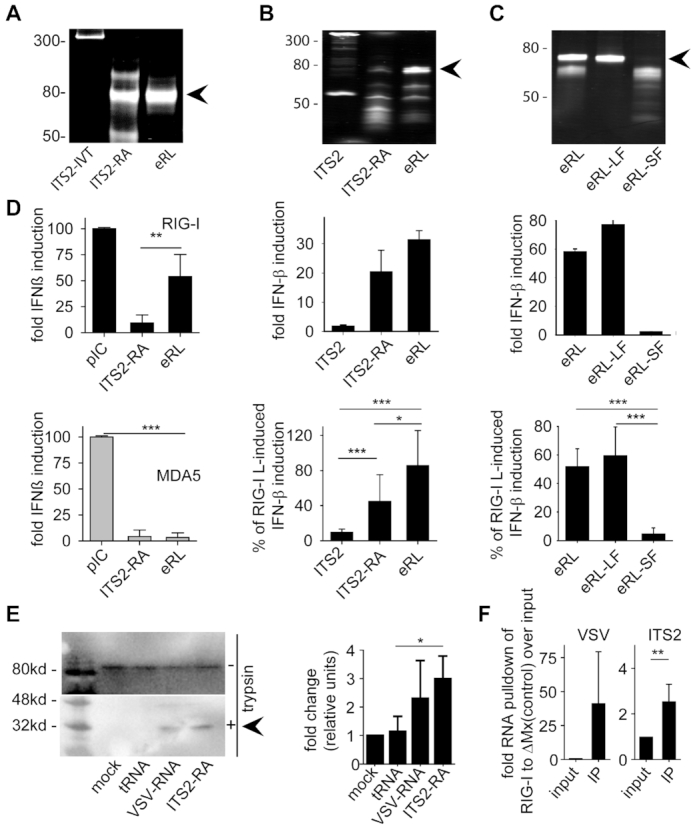
Figure 3.

The eRL is single stranded and located in the ITS2 region. (A) Non-denaturing PAGE analysis of various RNA samples: a 358 nucleotide ITS2 RNA fragment (ITS2-IVT), RNase A-digested ITS2-IVT (ITS2-RA) and gel purified band (eRL, endogenous RIG-I ligand). (B) HEK293-RIG-I-IFN-ß reporter cells were stimulated with 0.5 μg/ml ITS2-IVT, ITS2-RA and eRL and fold IFN-ß induction was determined after 12 h. (C) HEK293-RIG-I-IFN-ß reporter cells were stimulated with 0.5 μg/ml eRL, large fragment (eRL-LF) and small fragment (eRL-SF) and fold IFN-ß induction was determined after 12 h. Integrity and composition of RNA samples used for stimulation in (B) and (C) were monitored by denaturing PAGE analysis with subsequent SYBR-Gold staining (upper row). Fold IFN-ß induction is shown for one individual experiment (middle row) and a diagram combining three independent experiments each in biological triplicates with data adjusted to % of pIC induced IFN-β activation (lower row; nine measurements per data point ± S.D.). * P < 0.05, *** P < 0.001. (D) Huh7.5 cells expressing RIG-I or MDA5 were stimulated with 1 μg/ml pIC and 0.4 μg/ml ITS2, ITS2-RA or eRL for 6 h and IFN-β upregulation was determined by RT-PCR. Graph combines three independent experiments each in biological duplicates (six measurements per data point ± S.D.), *** P < 0.001, ** P < 0.01, * P < 0.05. (E) A549 cells were transfected with controls and eRL at 200 ng/ml for 1 h. RIG-I activation was marked by a remaining 30 kDa fragment after limited trypsin digestion in conformational switch assay. Western blot shows one representative result out of three independent experiments. Diagram combines three independent experiments with data adjusted to % of mock-induced conformational switch (three measurements per data point ± S.D.), * P < 0.05. (F) HEK293 ΔRIG-I were transfected with flag-tagged RIG-I or ΔMx and stimulated with 250 ng VSV-RNA or eRL 24 h later. Immunoprecipitation of flag-tagged proteins was performed 6 h after stimulation and RNA binding was determined in qRT-PCR. First panel shows pulldown of VSV-RNA as a positive control, last panel shows pulldown of eRL. Diagram combines three independent experiments each in biological duplicates (six measurements per data point ± S.D), * P < 0.05.
