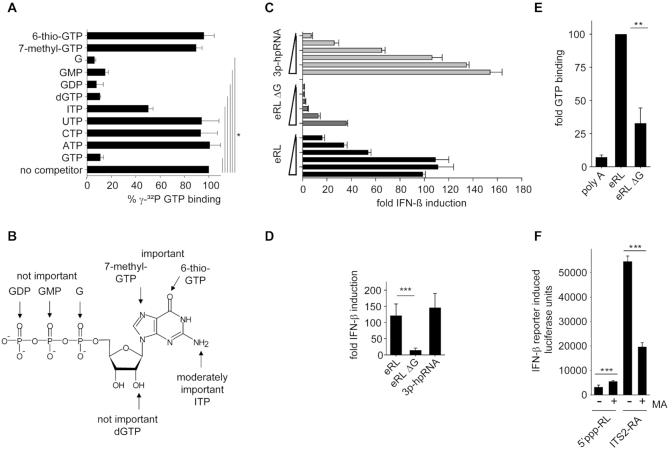
Figure 6.
The eRL functions as an aptamer and binds GTP. (A) Competitive binding studies with IVT-eRL, γ-32P GTP and indicated unlabeled competitors. Percentage γ-32P GTP binding = [(amount of radiolabeled GTP bound in the presence of unlabeled competitor) / (amount of radiolabeled GTP bound in the absence of indicated competitor)] × 100. Graph combines two independent experiments each in duplicates (four measurements per data point ± S.D.), * P < 0.05. (B) Data from competitive binding experiments mapped to the structure of GTP. (C, D) HEK293-RIG-I-IFN-ß reporter cells were stimulated with eRL, eRL ΔG or 3p-hpRNA at 0.25; 0.063, 0.016, 0.0039 or 0.00098 μg/ml. Luciferase activity was measured 12 h after ligand stimulation. (C) One representative experiment is shown and (D) a statistical analysis at the concentration of 0.063 μg/ml combining three independent experiments each in biological duplicates (6 measurements per data point ± S.D.) is depicted, *** P < 0.001. (E) GTP binding studies utilizing 0,1 nmol eRL, eRL ΔG or poly A and γ-32P GTP. GTP binding by eRL is set to 100. Graph combines three independent experiments each in duplicates (six measurements per data point ± S.D.), * P < 0.05. (F) Stimulation of HEK293-RIG-I-IFN-ß reporter cells that where mock-treated or pre-incubated with 10 μM mycophenolic acid (MA) for 24 h and subsequently incubated with 0.5 μg/ml 5′ppp-RL or 1 μg/ml ITS2-RA. Luciferase activity was measured 12 h after ligand stimulation. One individual experiment is shown (first panel) and a diagram combining three independent experiments each in triplicates with data adjusted to the ratio of IFN-β activation without and with MA treatment (last panel; nine measurements per data point ± S.D.), *** P < 0.001.

