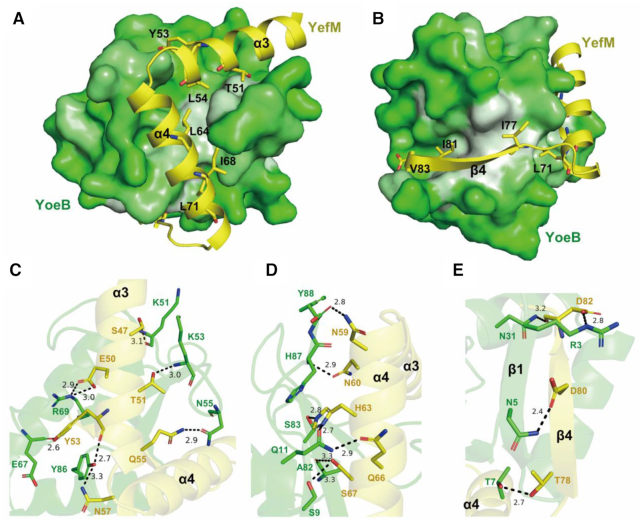
Figure 3.
Interactions between YoeB and YefM. (A and B) The hydrophobic interaction between YoeB and YefM. The hydrophobic surface of YoeB are presented in white, while the hydrophobic residues of YefM are shown as sticks. (C–E) The detailed hydrogen-bonds interaction of YoeB (green) and YefM (yellow) (α3 (C), α4 (D) and β4 (E)) are presented as blank dashed lines.

