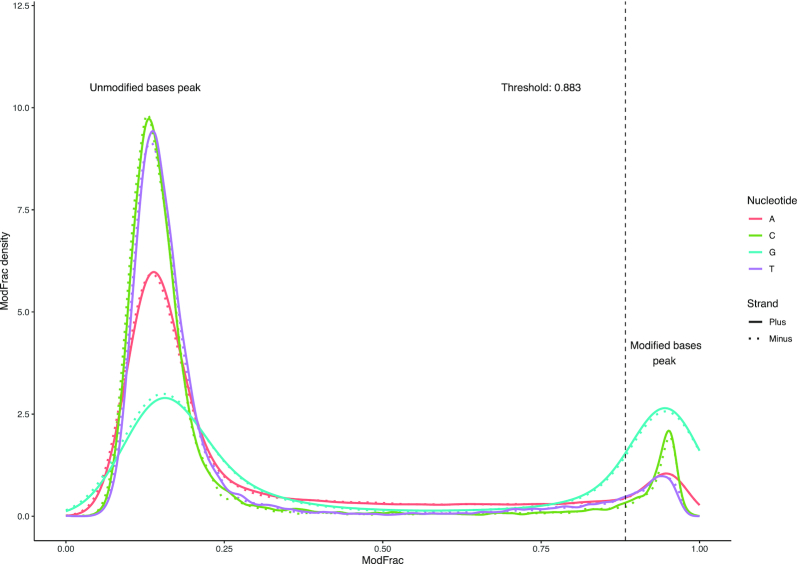
Figure 2.
Density plot of the modified fraction for each nucleotide in the CAjan WT dataset. Continuous line shows plus strand, while dashed line shows minus strand. The vertical line indicates the ModFrac cutoff calculated as the mean of the rightmost peak for G (plus strand) subtracted by one standard deviation.

