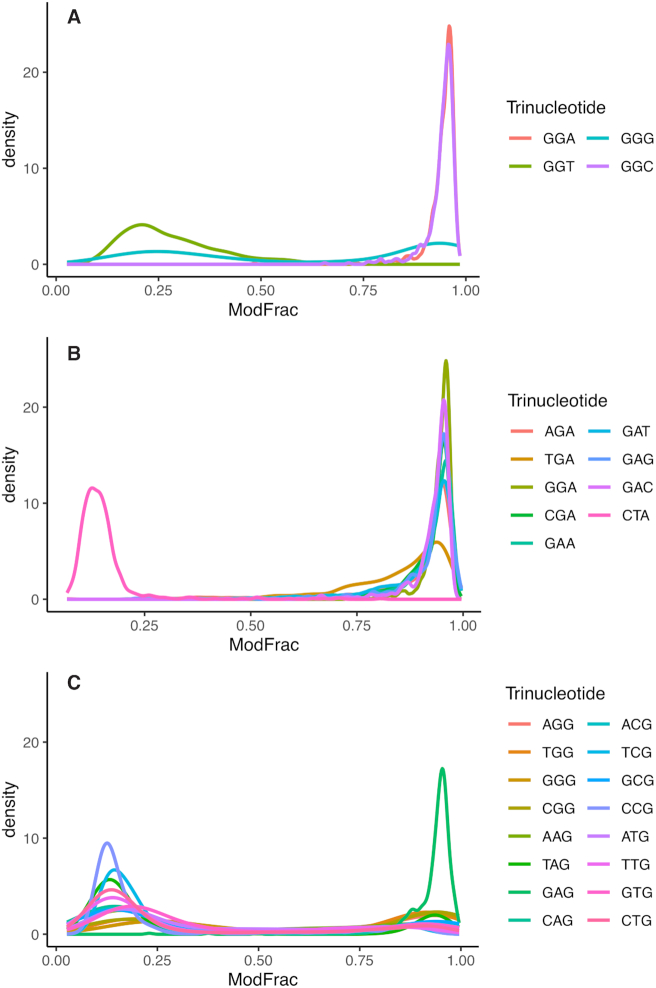
Figure 8.
Density plots showing fraction of modified first bases for selected trinucleotide combinations. (A) All trinucleotide combinations starting in GG (GGN). (B) All trinucleotide combinations containing GA (NGA and GAN) with CTA included as a negative control, showing no modification nor neighbouring effect. (C) All trinucleotide combinations ending in guanine (NNG).

