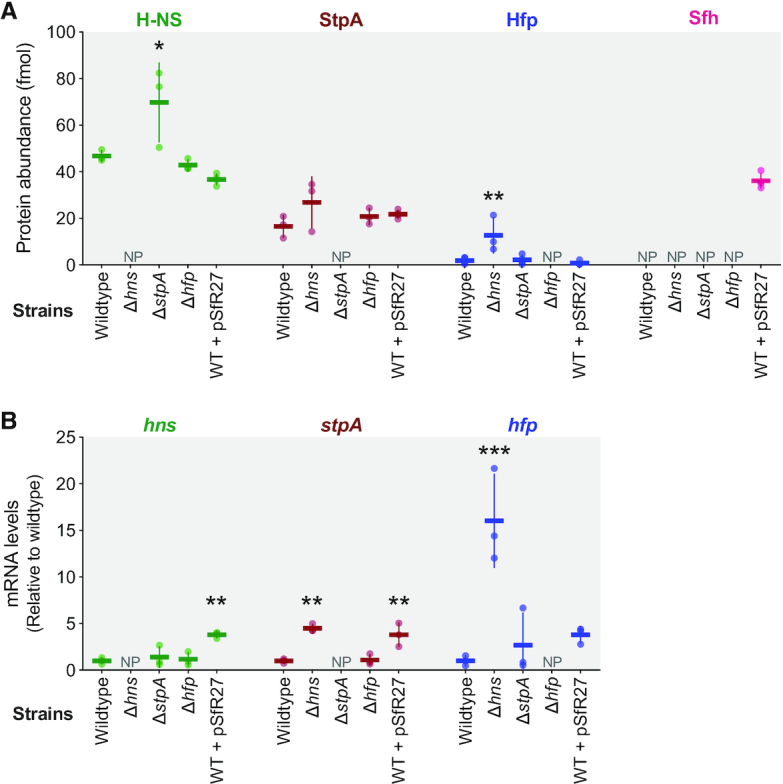
Figure 4.

Protein abundance and expression of H-NS family proteins in S. Enteritidis EN1660. Cellular protein concentration was quantified by mass spectrometry (A) and relative mRNA level was quantified by quantitative PCR (B) for H-NS (green), StpA (red) and Hfp (blue) in wildtype strain EN1660 and Δhns, ΔstpA, Δhfp mutants during exponential phase. The cellular protein concentration of Sfh was also quantified in wildtype strain EN1660 along with quantification of the impacts of pSf-R27 on hns, stpA and hfp gene expression. The mean and standard deviation of three to four biological replicates is shown. NP: not present (and not detected). Statistical differences were calculated by one-way ANOVA using Dunnett's multiple comparison test of mutants versus wild type. P values <0.05 (*), <0.01 (**), <0.001 (***).
