Figure 1.
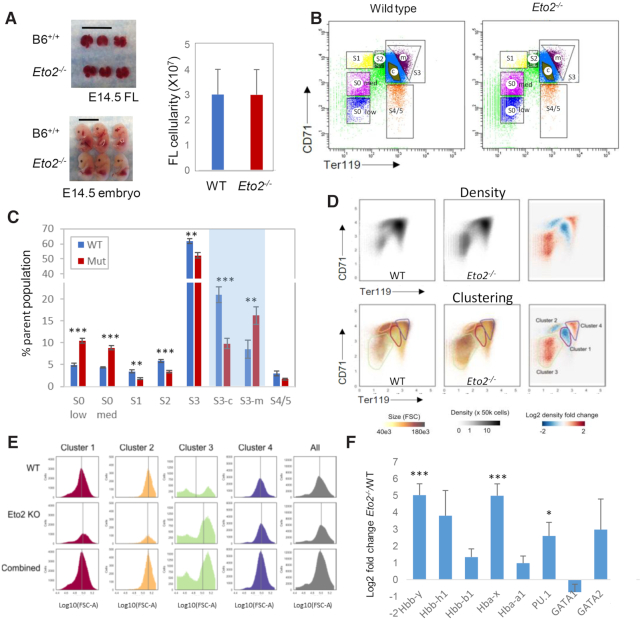
Maturational defect in erythropoiesis and persistence of embryonic globin gene transcription in Eto2−/− mice. (A) E14.5 embryos and livers of Eto2−/− and littermate control C57BL/6 mice are similar in size and appearance (left) and cellularity (right). (B) Flow cytometry with gates set to separate maturational stages S0–S4/5 for E14.5 fetal liver cells of Eto2−/− (right) and wildtype (WT, left) littermates. S0 low and S0 medium are defined as low GATA1 and medium GATA1, respectively (35). The x-axis depicts Ter119 (Glycophorin A, GYPA) staining intensity while the y-axis depicts CD71 (Transferrin receptor) intensity. (C) Quantification of each population S0 to S4/5 (panel B) from control (blue) and Eto2−/− (Mut, red) E14.5 fetal livers. Shaded area represents sub-gating of population S3. Error bars indicate SD. N = 11 biological replicates. **P< 0.01, ***P< 0.001 by two-tailed Student's t-test. (D) Flow cytometry densities of WT control (top left panel), Eto2−/− (top center panel) fetal liver cells from embryos at E14.5 and log2 fold ratio of Eto2−/− compared to WT control (top right panel). Bottom left and bottom center show the same points but colored by magnitude of forward scatter. Bottom right shows difference plot again but with convex hulls describing clusters overlaid. (E) Top. histograms of forward scatter in each of the clusters indicated in D. Vertical line in each panel indicates the mean. (F) Log2 fold change of expression for selected genes in population S4/5 RNA-seq for Eto2−/− compared to WT cells. Error bars represent standard error of the log2 fold change. Padj values shown *<0.05, ***<0.001.

