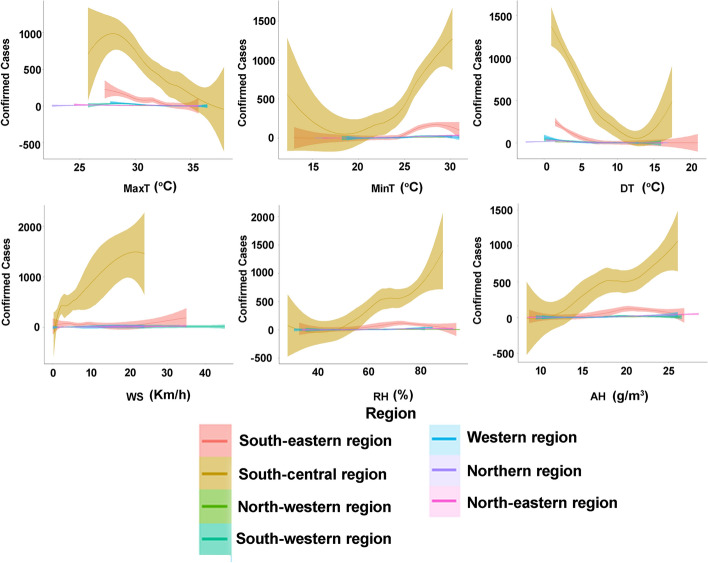
Fig. 3.
COVID-19 daily confirmed cases and the expected values based on the maximum temperature (MaxT), minimum temperature (MinT), diurnal temperature (DT), wind speed (WS), relative humidity (RH) and absolute humidity (AH) in seven climatic regions of Bangladesh from March 08 to May 31, 2020, respectively. The green line represents the expected value of a daily confirmed case based upon a LOESS regression for all days of available estimates. LOESS, locally weighted regression and smoothing scatter plots

