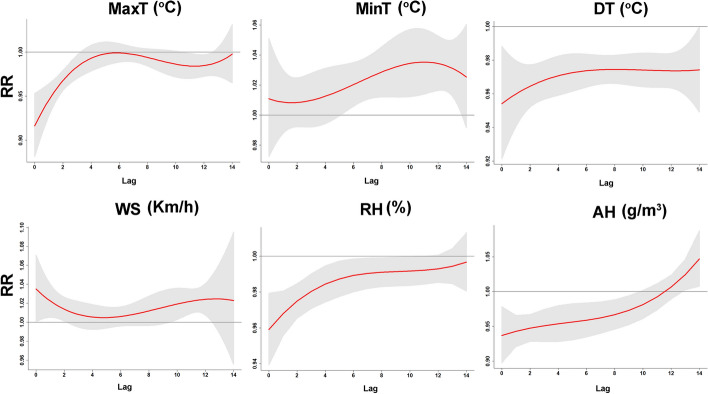
Fig. 5.
Single effects of MaxT, MinT, DT, WS, RH and AH. The Y lab denotes the value of relative risk (RR); the X lab indicates the value of relevant parameters. The red lines denote mean RR, and the gray regions represent 95% CIs. The black vertical line indicates the medians of the climatic variables, respectively

