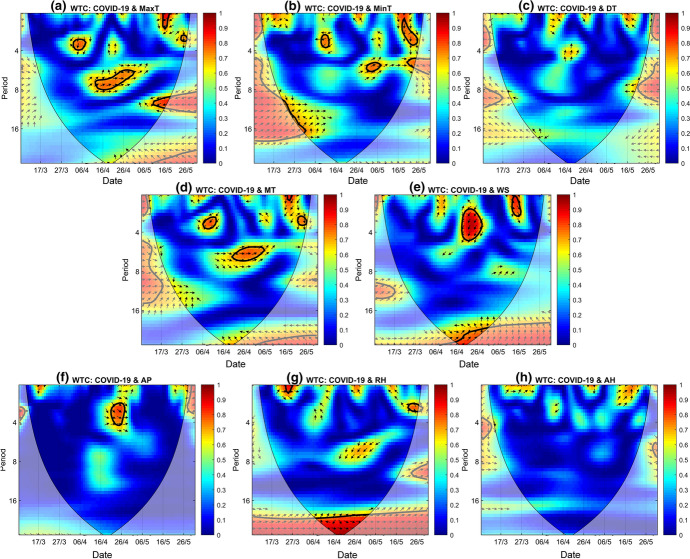
Fig. 7.
Wavelet coherence (WTC) between COVID-19 confirmed case series with MaxT (a), MinT (b), DT (c), MT (d), WS (e), AP (f), RH (g) and AH (h). (The thick black cone-shaped contours show the 95% significance level, and the black line is the cone of influence. “→” denotes that the two series are in phase, while “←” means anti-phase relationship; “↓” indicates that the COVID-19 confirmed case series is ahead of the climatic indices, whereas “↑” means that the COVID-19 confirmed case series is lagged behind the climatic indices.)

