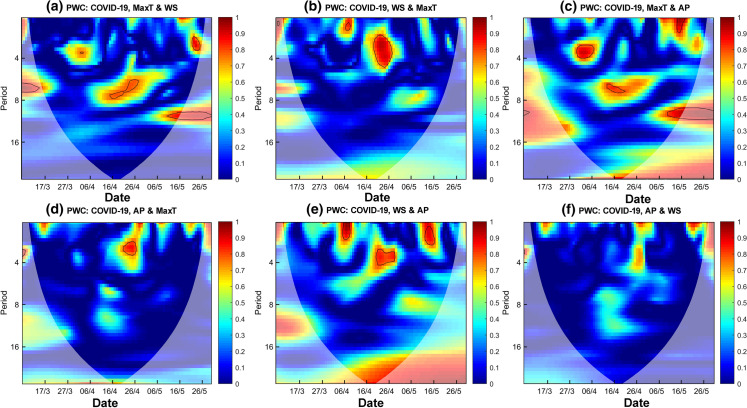
Fig. 8.
Partial wavelet coherence (PWC) of COVID-19 confirmed case series with MaxT & WS (a), WS & MaxT (b) MaxT & AP (c), AP & MaxT (d), WS & AP (e), AP & WS (f). The gradient bars indicate the variation in wavelet coefficients. The 5% significance level against red noise is shown as a thick contour. The regions outside of the fine black cone curve are outside the cone of influence where edge

