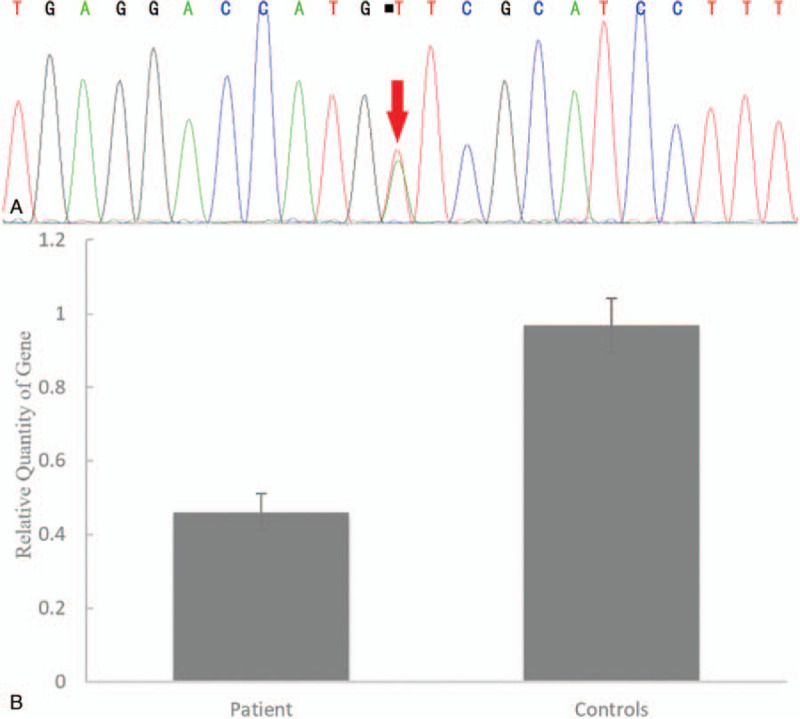
Figure 3.

DNA sequencing analysis. (A) Sanger sequence analysis shows a known mutation c.620A > T in exon 3 (red arrow), resulting in the substitution of aspartic acid with valine. (B) Real-time quantitative PCR sequence analysis shows exon 1 content in the patient was reduced to 48% compared with the controls. (mean calculation ratio: 0.46 ± 0.05; control results: 0.96 ± 0.07). PCR = polymerase chain reaction.
