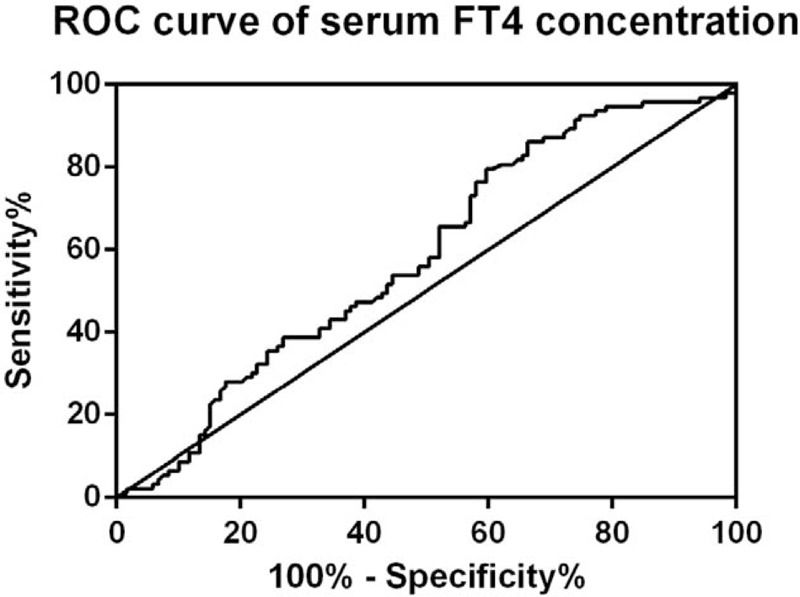
Figure 1.

ROC curve of serum FT4 concentration. ROC curve revealed that FT4 level of 6.445 pmol/L was the optimal cutoff point for prediction of hyperprolactinemia (AUC, 0.5829; P = .03849). AUC = area under ROC curve; FT4 = free tetraiodothyronine; ROC = receiver operating characteristics.
