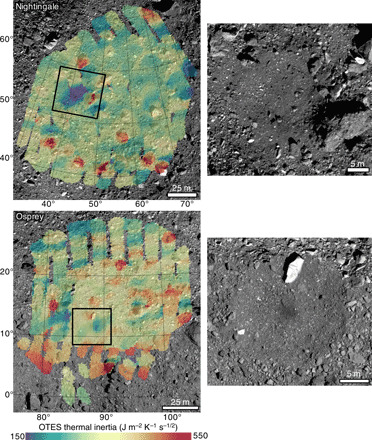
Fig. 4. Local thermal inertia maps of the Nightingale and Osprey candidate sample sites.

These maps were produced from Recon A OTES data using surface roughness measured by OLA. Values are overlaid on the global basemap (99).

These maps were produced from Recon A OTES data using surface roughness measured by OLA. Values are overlaid on the global basemap (99).