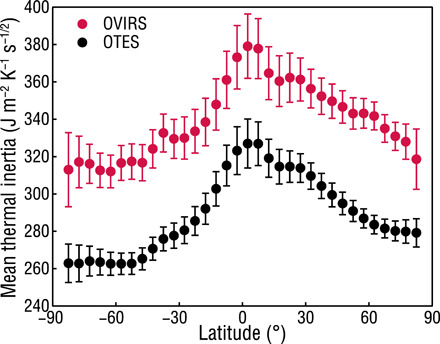
Fig. 5. Variation of mean thermal inertia with latitude on (101955) Bennu.

This plot was produced by averaging the global map values of Fig. 1 within latitude bins of 5° in width. The OVIRS-derived values are offset from the OTES-derived values by +50 J m−2 K−1 s−1/2, and the error bars represent the variation of the mean thermal inertia uncertainty with latitude.
