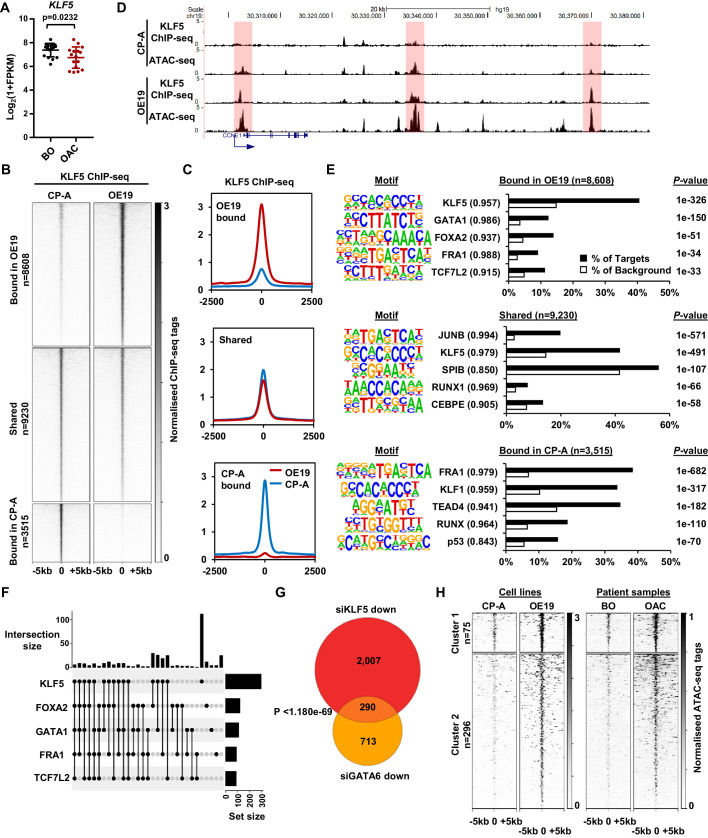
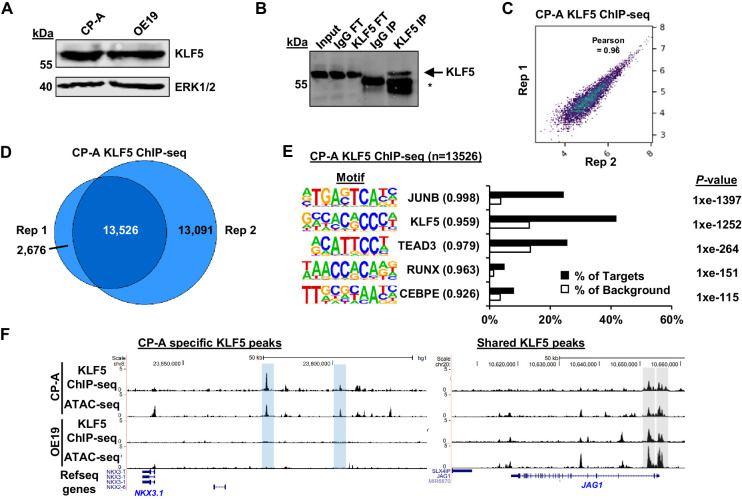
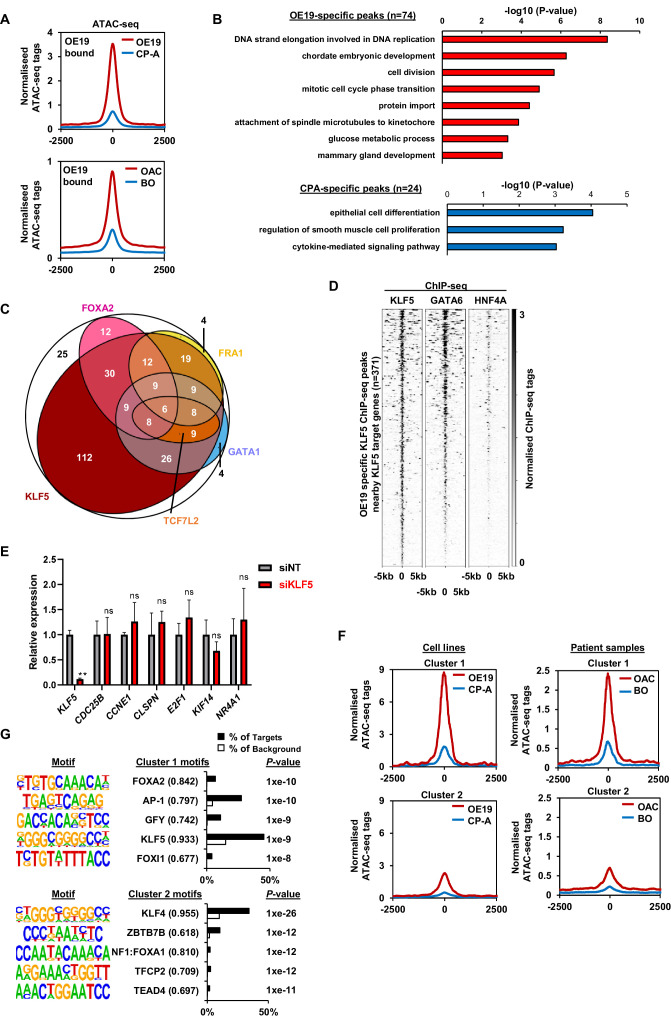
Figure 4. KLF5 binds to distinct regions in OE19 cells.
(A) Expression Log2(1+FPKM) of KLF5 in BO and OAC tissue. (B) Heatmap of KLF5 ChIP-seq signal at regions (peak centre ±5 kb) significantly bound in OE19 only (+2x; Q < 0.05), shared regions (no significant change) and regions bound in CP-A only (−2x; Q-value <0.05). (C) Tag density plot of KLF5 ChIP-seq signal at regions (peak centre ±2.5 kb) bound in OE19 only, shared regions and regions bound in CP-A only. (D) Genome browser tracks showing KLF5 ChIP-seq and ATAC-seq in CP-A and OE19 cells at the CCNE1 locus. Differential bound regions are highlighted in red. (E) Bar chart of percentage targets and percentage background of de novo discovered motifs at regions bound in OE19 only, shared regions and regions bound in CP-A only. De novo motifs, called transcription factor with match scores and P-values shown. (F) UPSET plot of DNA motifs found in 371 KLF5 binding regions that are specific to OE19-specific binding regions that are located within loci (+/- 250 kb) containing genes upregulated in OAC and downregulated with KLF5 depletion. The motifs identified in E (KLF5, GATA1, FOXA2, FRA1 and TCF7L2) found within each peak are shown. (G) Venn diagram showing the overlap in genes downregulated in OE19 cells following treatment with siRNAs targeting KLF5 and GATA6. (H) Heatmap of ATAC-seq signal at the KLF5 binding regions from (F) in the indicated cell lines (left) or patient derived tissue (right). Regions were subject to k-means hierarchical clustering (k = 2). See also Figure 4—figure supplements 1 and 2.


