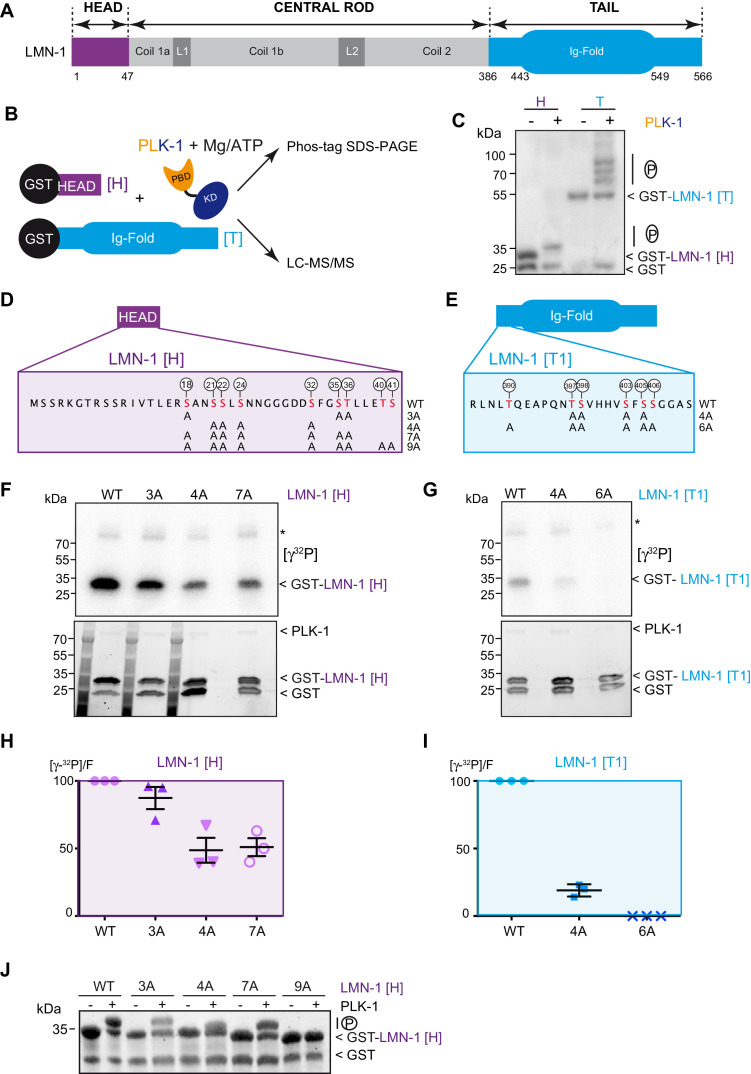
Figure 1. PLK-1 phosphorylates LMN-1 head and tail domains at multiple sites in vitro.
(A) Schematic of LMN-1 domain structure. Similar to lamins from other species, LMN-1 has a tripartite structure consisting of non-α-helical N-terminal head (violet) and C-terminal tail (blue) domains flanking an α-helical central rod domain. The C-terminal tail contains the Ig-fold motif. (B) Schematic of the approach used to investigate whether PLK-1 directly phosphorylates LMN-1 head and tail domains and to map the phosphorylated sites by tandem mass spectrometry (LC-MS/MS). (C) In vitro kinase assay was performed with C. e PLK-1 and the GST-LMN-1 head or tail as substrates. The samples were subjected to Phos-Tag SDS-PAGE followed by a western blot analysis using GST antibody. (D–E) Protein sequence of the head and tail domains with the residues phosphorylated by PLK-1 in red. The position of the phosphorylated residues is also indicated by white circles. The different non-phosphorylatable versions of LMN-1[H] 3A, 4A, 7A, 9A and LMN-1[T1] 4A, 6A with the positions of the alanine substitutions are presented below the protein sequence. (F–G) In vitro kinase assays using PLK-1 and LMN-1 WT or mutated fragments (LMN-1[H] and [T1]) as substrates. An autoradiograph of the SDS-PAGE showing γ-[32P] incorporation in LMN-1 (upper panel). Coomassie brilliant blue (CBB) staining of the same SDS-PAGE (bottom panel). Asterisk marks autophosphorylated PLK-1. GST is present as an impurity from the production of GST-LMN-1 fragments. (H–I) The graphs correspond to the quantification of the radioactivity incorporated into LMN-1 [H] and [T1] fragments divided by the total amount of LMN-1 fragments quantified using tryptophan fluorescence (Stain-Free; Bio-Rad). The ratio obtained for the WT fragments was arbitrary defined as 100. The quantification of three independent experiments is presented. Error bars represent the standard deviation. (J) In vitro kinase assay was performed with C. e PLK-1 and the GST-LMN-1 [H] WT or mutated fragments as substrates. The samples were subjected to SDS-PAGE and the gel was revealed using tryptophan fluorescence (Stain-Free; Bio-Rad).


