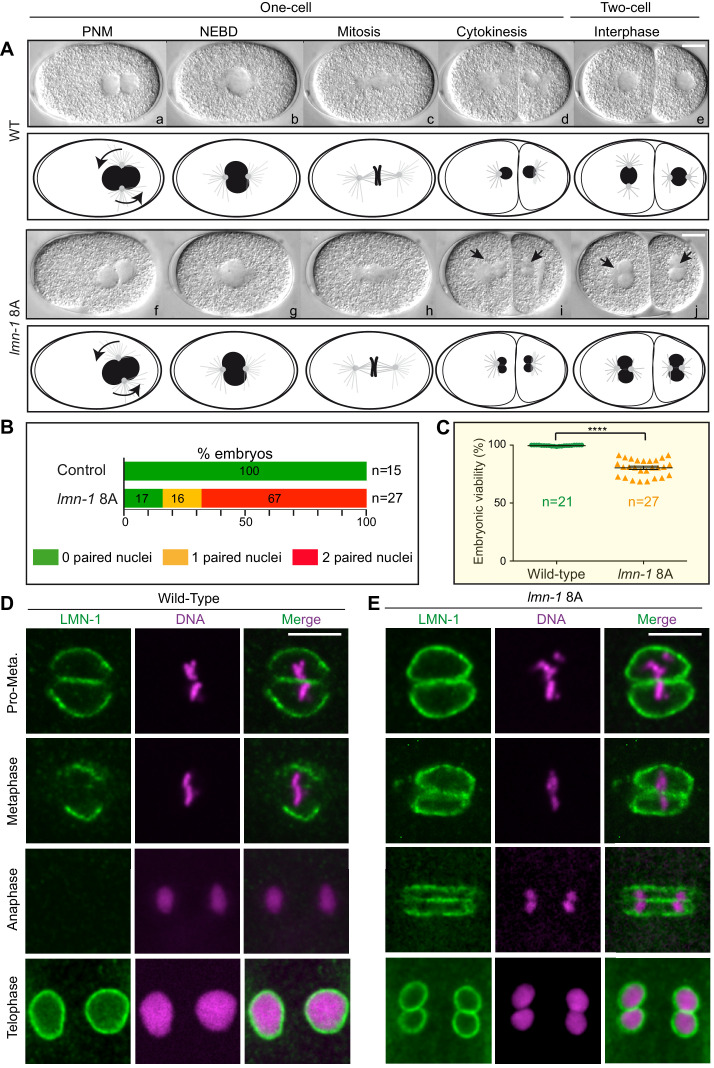
Figure 4. Non-phosphorylatable LMN-1 8A is sufficient to cause the appearance of embryos with a paired nuclei phenotype.
(A) Differential interference contrast micrographs and corresponding schematics of the first two divisions in wild type (WT) (a–e) and lmn-1 8A (f–j) embryos at 23°C. Black arrowheads highlight paired nuclei in lmn-1 8A mutant embryos. PNM: Pronuclear meeting, NEBD: nuclear envelope breakdown. Scale Bar, 10 μm. (B) Percentage of WT and lmn-1 8A two-cell stage embryos presenting 0 (green bars), 1 (orange bars) or 2 (red bars) paired nuclei at the two-cell stage at 23°C. The number of embryos analyzed (n) is indicated on the right and was generated by aggregation over more than three independent experiments. The values inside the bars represent the percentage of embryos of a given phenotype. (C) Graph presenting the embryonic viability (%) determined from wild-type (n = 21) and lmn-1 8A (n = 27) mutant animals. Data were collected from two independent experiments containing each two replicates. The results are presented as means ± SEM. **** indicates p<0.0001. (D–E) Confocal images of fixed wild-type and lmn-1 8A mutant one-cell embryos in pro-metaphase, metaphase, anaphase and telophase, stained with LMN-1 antibodies (green) and counterstained with DAPI (magenta). All panels are at same magnification. Scale Bar, 10 μm.

