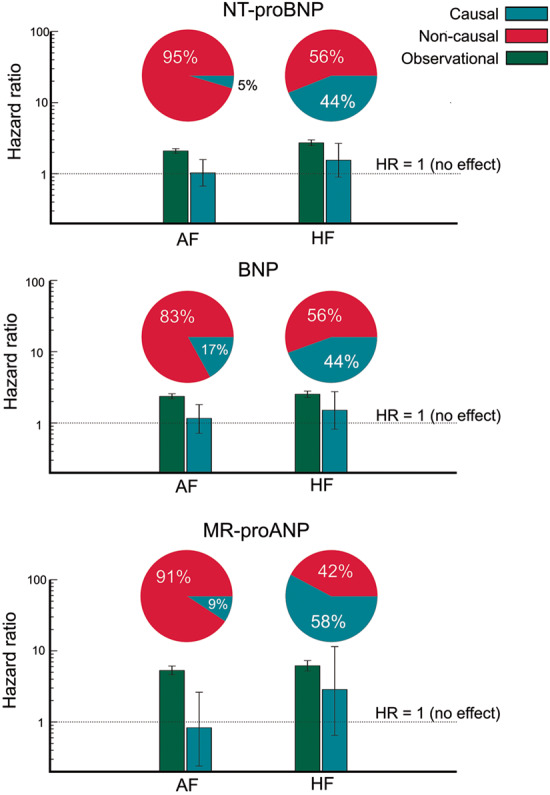
Figure 2.

Comparison of observational HRs, causal HRs, and non-causal HRs. HRs and 95% confidence intervals are provided. The pie charts illustrate the percentage of non-causal and causal beta coefficients of the observational beta coefficient. In the AF/MR-proANP case there is a negative causal beta coefficient. In order to avoid negative percentages or percentages larger than 100, the absolute values of the causal and non-causal beta coefficients were expressed as a percentage of their sum. AF, atrial fibrillation; BNP, B-type natriuretic peptide; HF, heart failure; HR, hazard ratio; MR-proANP, mid-regional pro atrial natriuretic peptide.
