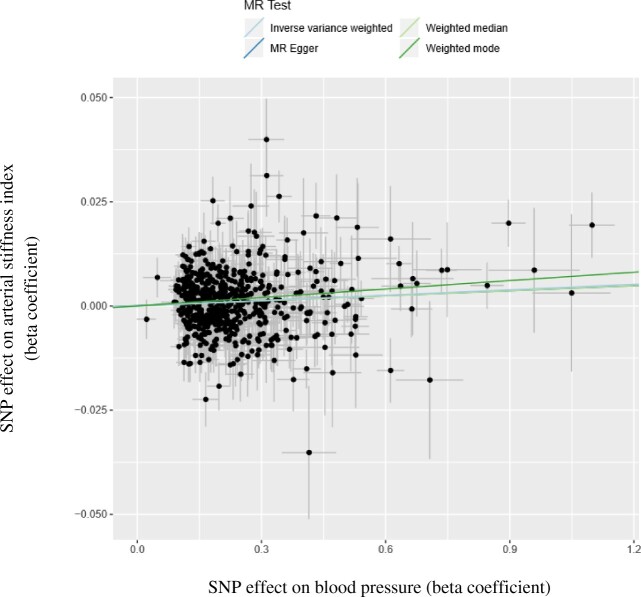
Figure 4.
The association between the effect of blood pressure associated single-nucleotide polymorphisms (SNPs) on the arterial stiffness index (y-axis) plotted against the effect of blood pressure associated SNPs on blood pressure (x-axis). The slope of the regression line represents the causal association estimated using different regression methods.

