Figure 4.

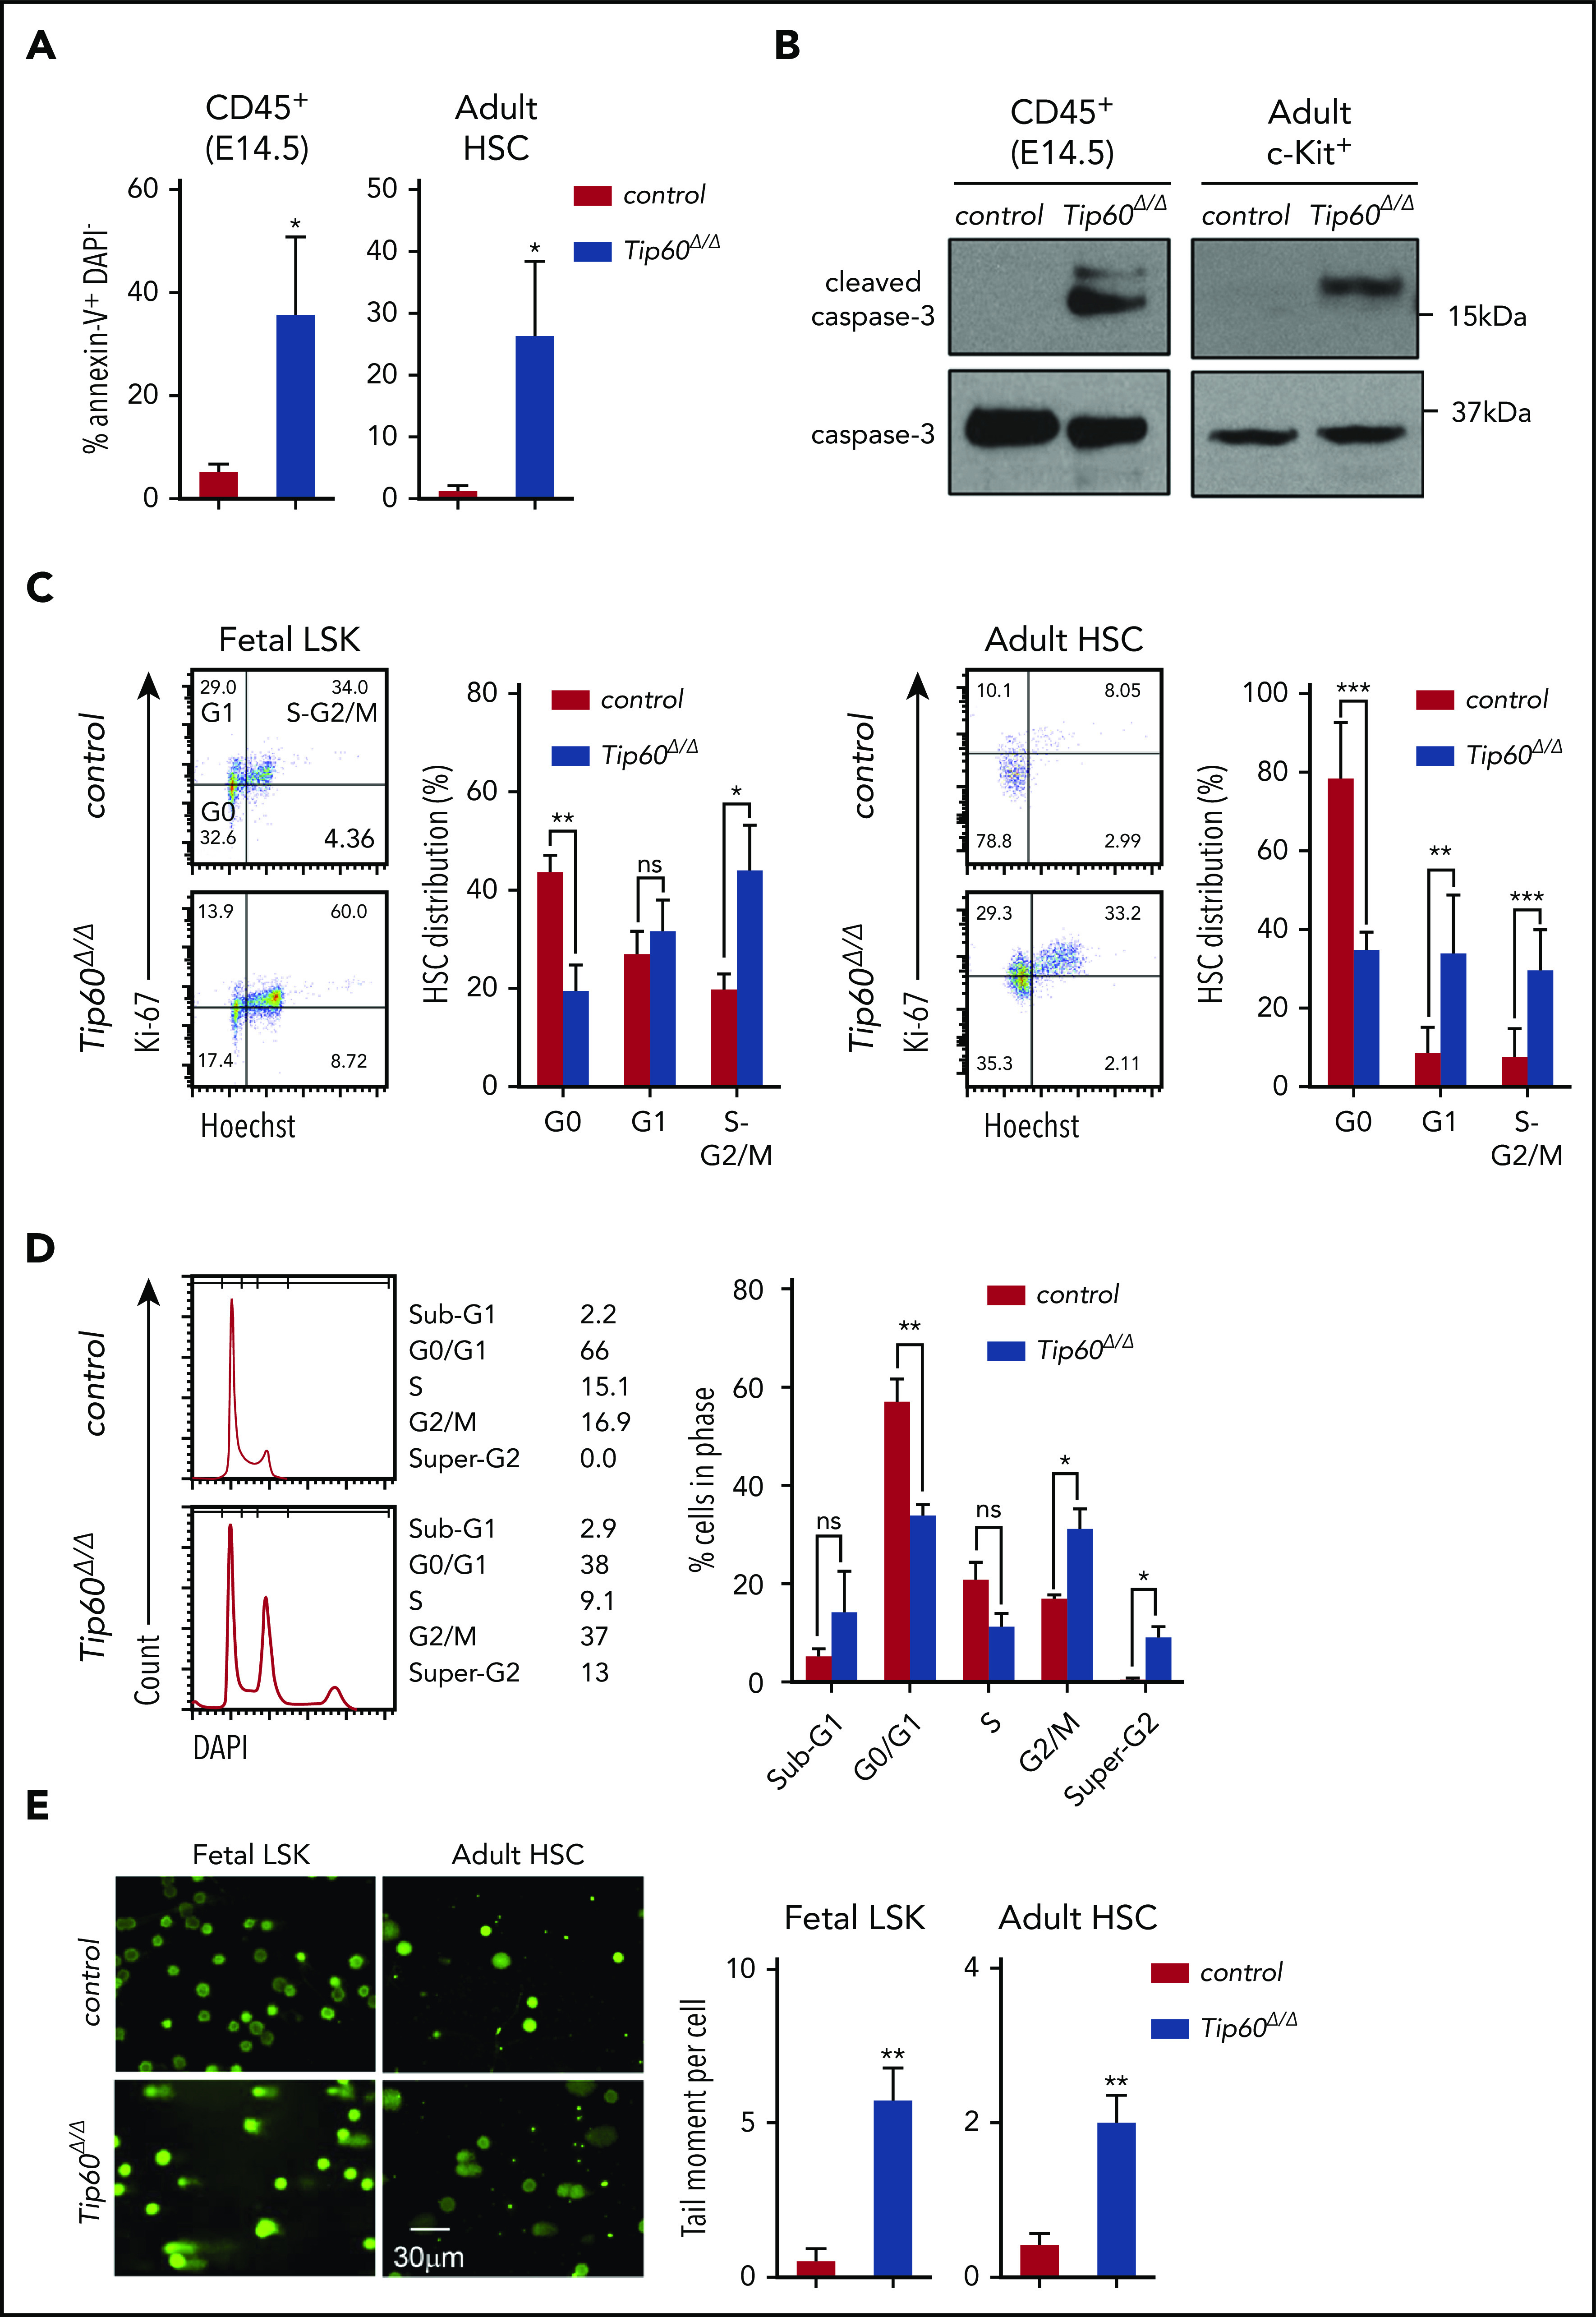
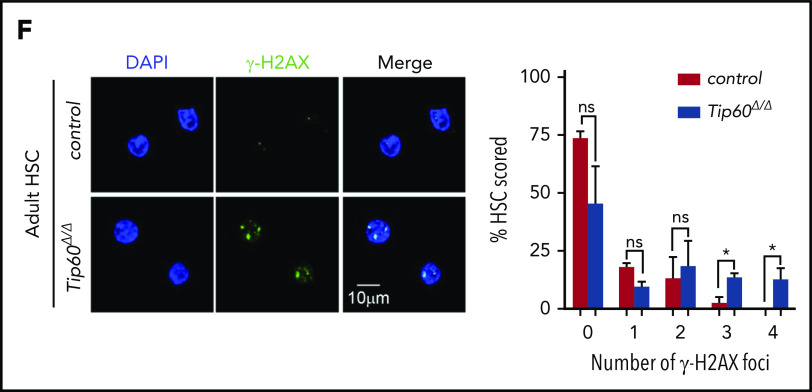
Tip60 loss leads to apoptosis and impairs cell cycle progression in HSCs. (A) Annexin V and DAPI staining of CD45+ cells from E14.5 embryos of control (Tip60f/+; n = 3), Tip60Δ/Δ (Tip60f/f; Vav-iCre) (n = 4), and BM CD150+CD48−LSK cells from control (Tip60f/f; n = 3) and Tip60Δ/Δ (Tip60f/f;Mx1-Cre) mice (n = 3) (pIpC injection on days 1-3, and analysis on day 5). Percentages of annexin V+DAPI− cells are shown. (B) Immunoblot analysis of caspase-3 and cleaved caspase-3 using CD45+ cells from E14.5 embryos of control and Tip60Δ/Δ and BM c-Kit+ cells from control (Tip60f/+) and Tip60Δ/Δ mice. (C) Cell-cycle status of fetal LSK (E14.5) (left) and adult CD150+CD48− LSK cells (right) was analyzed by flow cytometry. Representative dot plots (left), with average percentages of cells in each phase (right). (D) DNA content analysis by DAPI staining of LSK cells purified from Tip60f/f and Tip60f/f; Rosa26-CreERT2 embryos at E14.5, treated with 4-OHT in culture for 5 days (left). Percentages of cells in each phase (right). (E) Assessment of DNA breaks by alkaline comet assay. Images of control (Tip60f/+) and Tip60Δ/Δ fetal LSK cells and control (Tip60f/f) and Tip60Δ/Δ adult CD150+CD48−LSK cells (left). Quantitative values of tail DNA moment (right). (F) Images of immunostaining of γ-H2AX in control (Tip60f/f) and Tip60Δ/Δ CD150+CD48−LSK cells (left). Percentages of cells (y-axis) that have a corresponding number of γ-H2AX foci (x-axis) are graphed (right). The values are presented as means ± standard error of the mean. *P < .05; **P < .01; ***P < .001; ns, not significant

