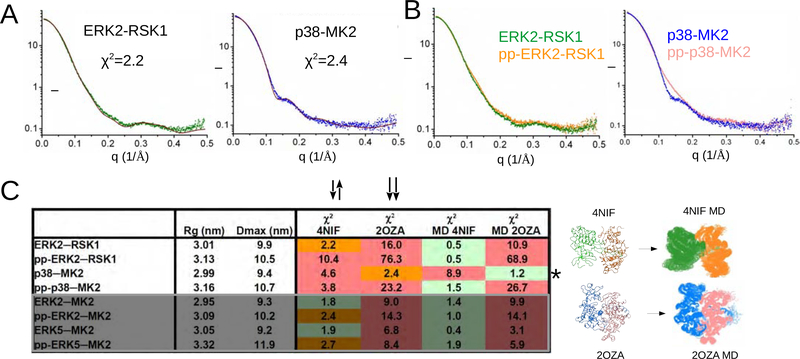
Figure 3. Structures of nonphosphorylated and phosphorylated heterodimers.
(A) Fit between the experimental scattering plots (ERK2-RSK1 in green, p38-MK2 in blue) and the simulated curves calculated with nonphosphorylated ERK2-RSK1 and p38α-MK2 crystal structures (in brown).
(B) Experimental SAXS plots for nonphosphorylated (green or blue) and active (pp) complexes (orange or salmon).
(C) Summary of SAXS analysis on four nonphosphorylated and four phosphorylated (pp) MAPK-MAPKAPK heterodimers. Rg: radius of gyration; Dmax: maximum dimension; χ2 : discrepancy value for the fit to the simulated solution scattering curve calculated with the crystal structure (4NIF or 2OZA) or to models chosen from the MD ensemble (MD 4NIF or MD 2OZA). Quality of the fit is color-coded: red – bad (χ2 > 3); orange – moderate (χ2 = 2–3); green – good (χ2 < 2). MD models used for ensemble modeling are shown below. The starting model for the MD runs is shown on the left and the MD generated ensemble (150 structures) is on the right. * highlights that the nonphosphorylated p38-MK2 complex has a different quaternary structure compared to all other nonphosphorylated or phosphorylated MAPK-MAPKAPK heterodimers. The last 4 rows in the table are boxed and shown in gray and contain results for ERK2-MK2 and ERK5-MK2, which were not analyzed further in this study but the data were used for comparison to ERK-RSK1 and p38-MK2 (shown in the upper 4 rows). See also Figure S4,5.

