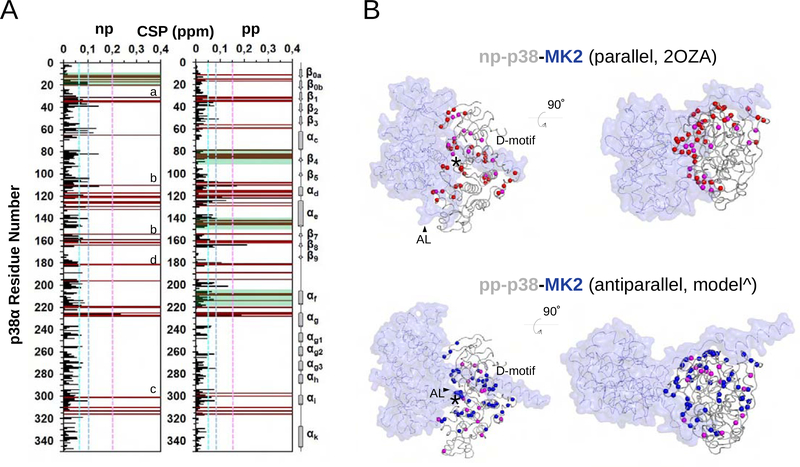
Figure 4. NMR analysis on MK2 binding of nonphosphorylated (np) or phosphorylated (pp) p38α.
(A) Histograms showing the 1H/15N chemical shift perturbations (CSPs) upon MK2 binding vs residue number for np-p38 (left) and pp-p38 (right). Peaks that are broadened beyond detection are shown in brown. Dashed lines indicate CSPs corresponding to 1ϭ, 2ϭ or 3ϭ changes. Biggest changes map to the Gly-rich loop (a), the MAPK docking groove: hydrophobic (b) or the charged CD groove (c), and to the activation loop (d) for both complexes. Regions displaying the greatest CSP differences between the two complexes are boxed in green (e.g. β0a-β0b, αC-β4, αe, or αf).
(B) Backbone nitrogen atoms displaying line broadening (red: np-p38; blue: pp-p38) or CSPs above 2ϭ (magenta) are shown in the parallel np-p38-MK2 crystal structure (PDB ID: 2OZA; top) or in the antiparallel pp-p38-MK2 model (bottom) with spheres. MK2 is colored blue and shown in transparent surface representation. * indicates the position of the p38 catalytic site. ^ this antiparallel model was built by multi-domain flexible docking. D-motif: MK2 docking motif binding in the MAPK docking groove. AL: MK2 activation loop. Note the different AL conformation in the parallel or in the antiparallel complex. Panels on the right show the same structure as on the left but the view is 90° rotated so that to see p38 from the top.

