
Figure 7.
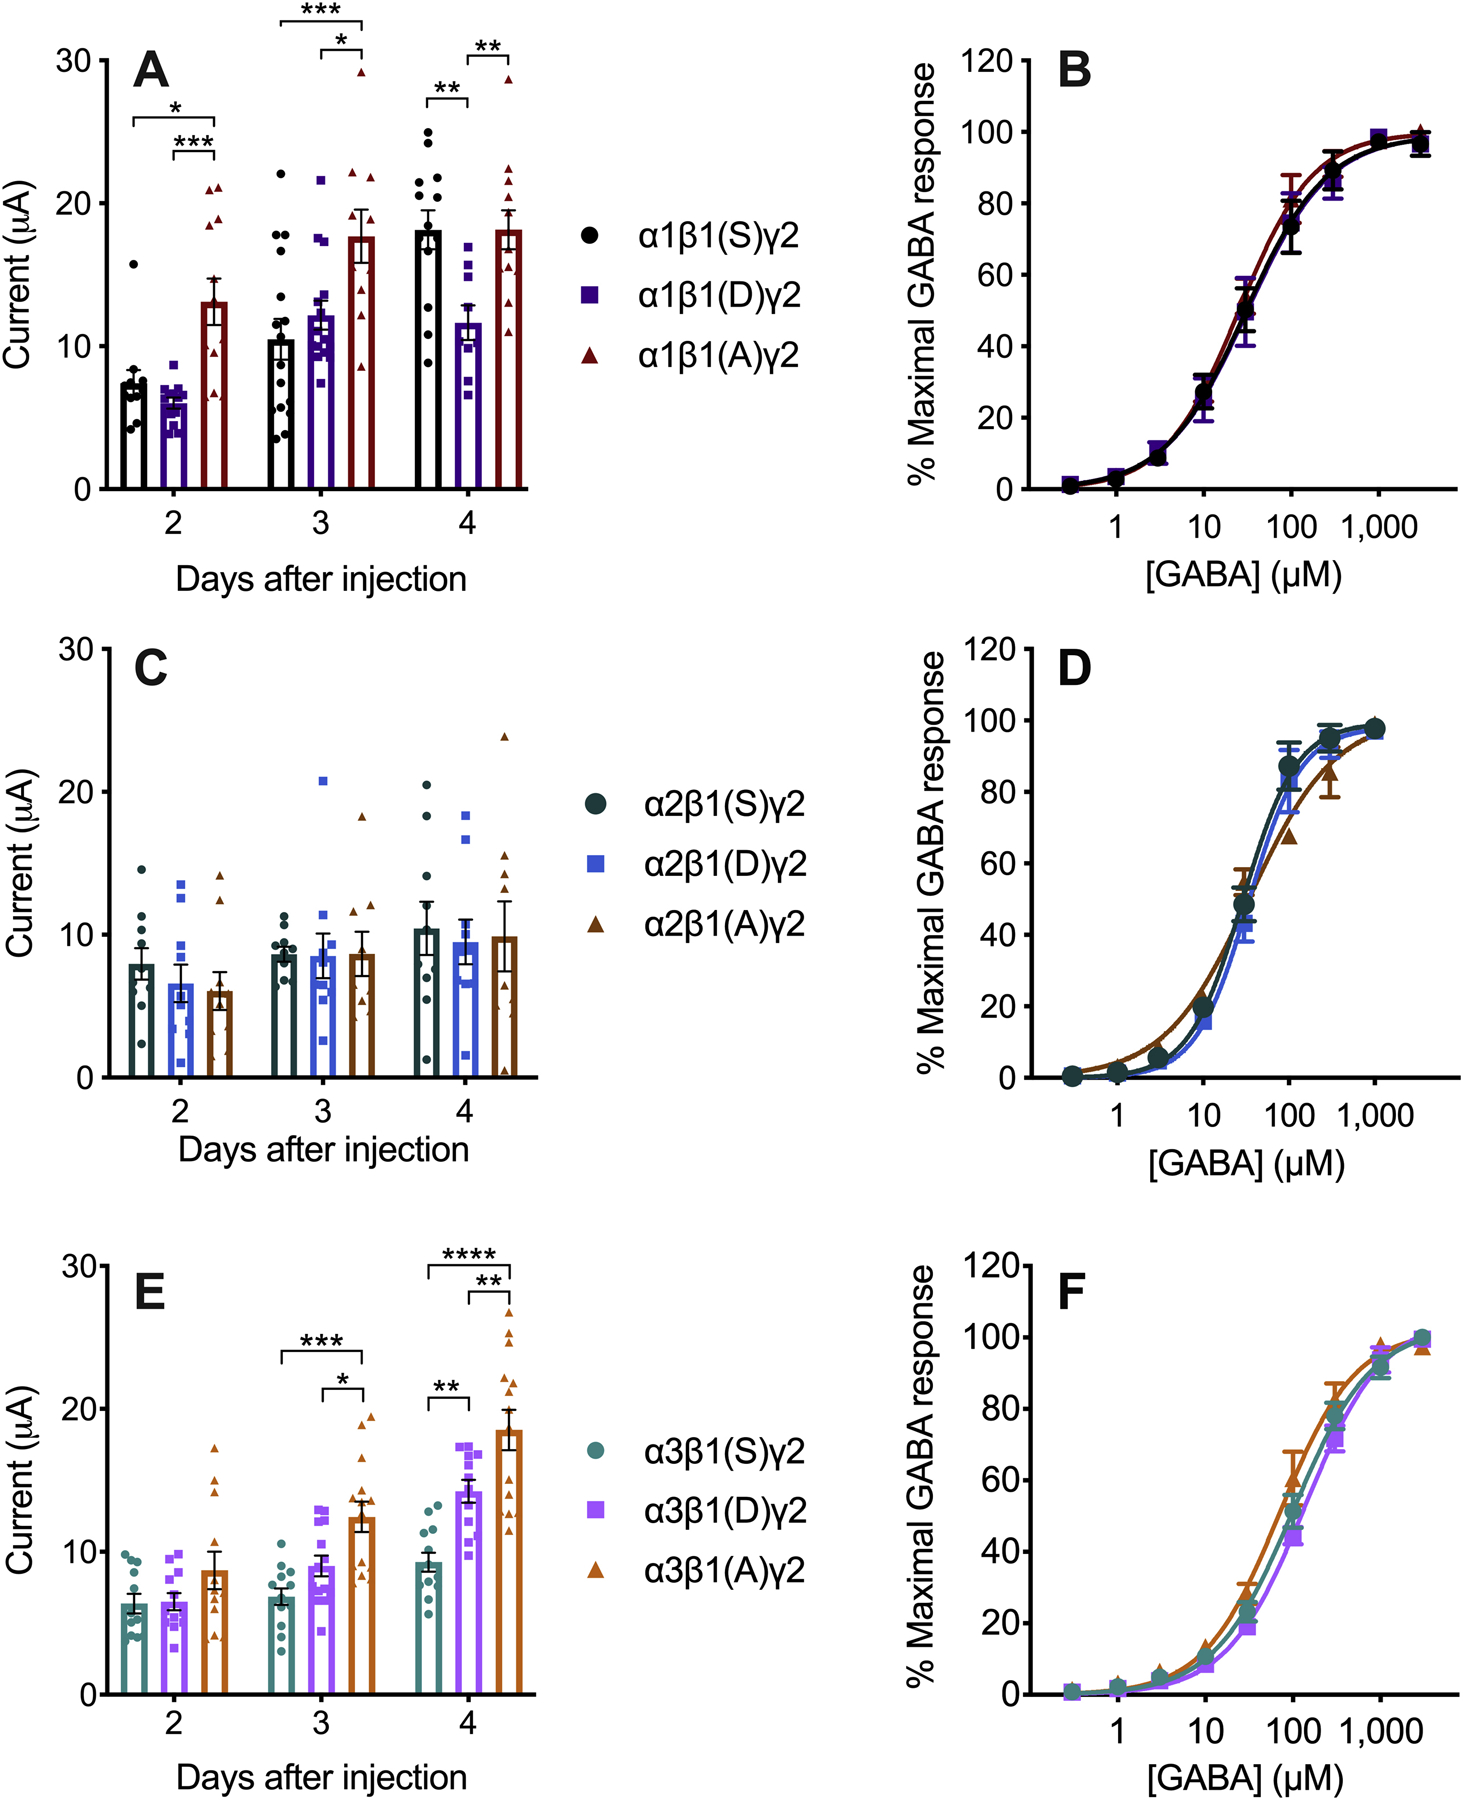
β1-containing GABAA receptors expressed in Xenopus laevis oocytes. The letters in parentheses in the legend indicate the residues in position 409 of β1. A) Currents induced by maximal GABA concentration (3 mM GABA, n = 9–16) and B) GABA concentration-response curves (n = 4–5) in α1β1γ2 GABAA receptors. C) Currents induced by maximal GABA concentration (300 μM GABA, n = 9–10) and D) GABA concentration-response curves (n = 4–5) in α2β1γ2 GABAA receptors. E) Currents induced by maximal GABA concentration (3 mM GABA, n = 12–14) and F) GABA concentration-response curves (n = 4–6) in α3β1γ2 GABAA receptors. Data were analyzed by two-way ANOVA followed by Sidak’s multiple comparisons test, *p ≤ 0.05, **p ≤ 0.01, ***p ≤ 0.001, ****p ≤ 0.0001.