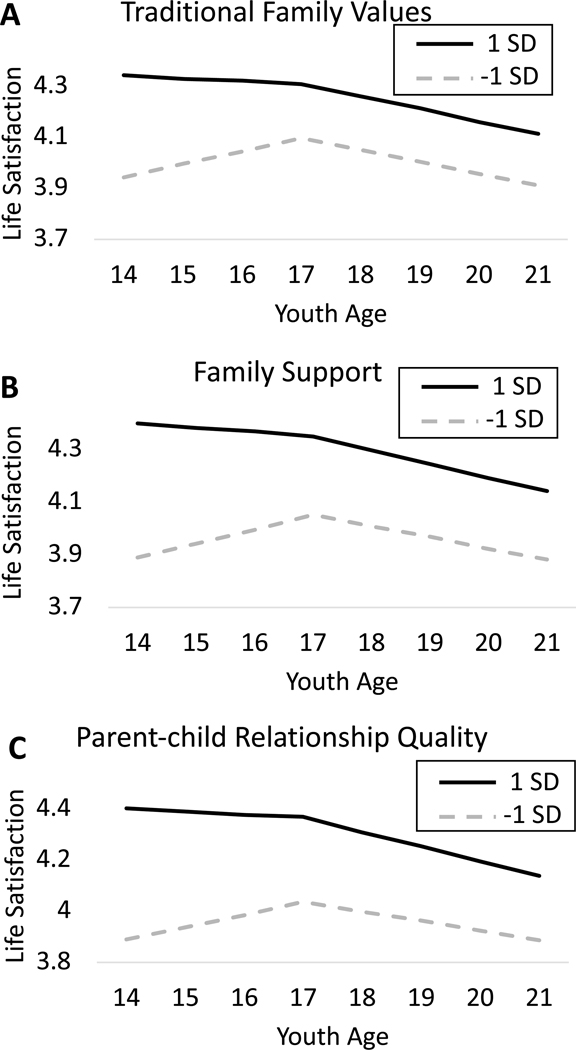
Figure 2.

Estimated life satisfaction trajectory from age 14 to 21 as a function of (A) endorsement of traditional family values at age 14; (B) family support at age 14; and (C) parent-child relationship quality at age 14. Trajectories are shown for youth one standard deviation above the mean (black solid line) and one standard deviation below the mean (grey dotted line) on each predictor variable. The range of the y axis is 1 standard deviation.
