
Figure 3. LCP-MicroED structure of proteinase K.
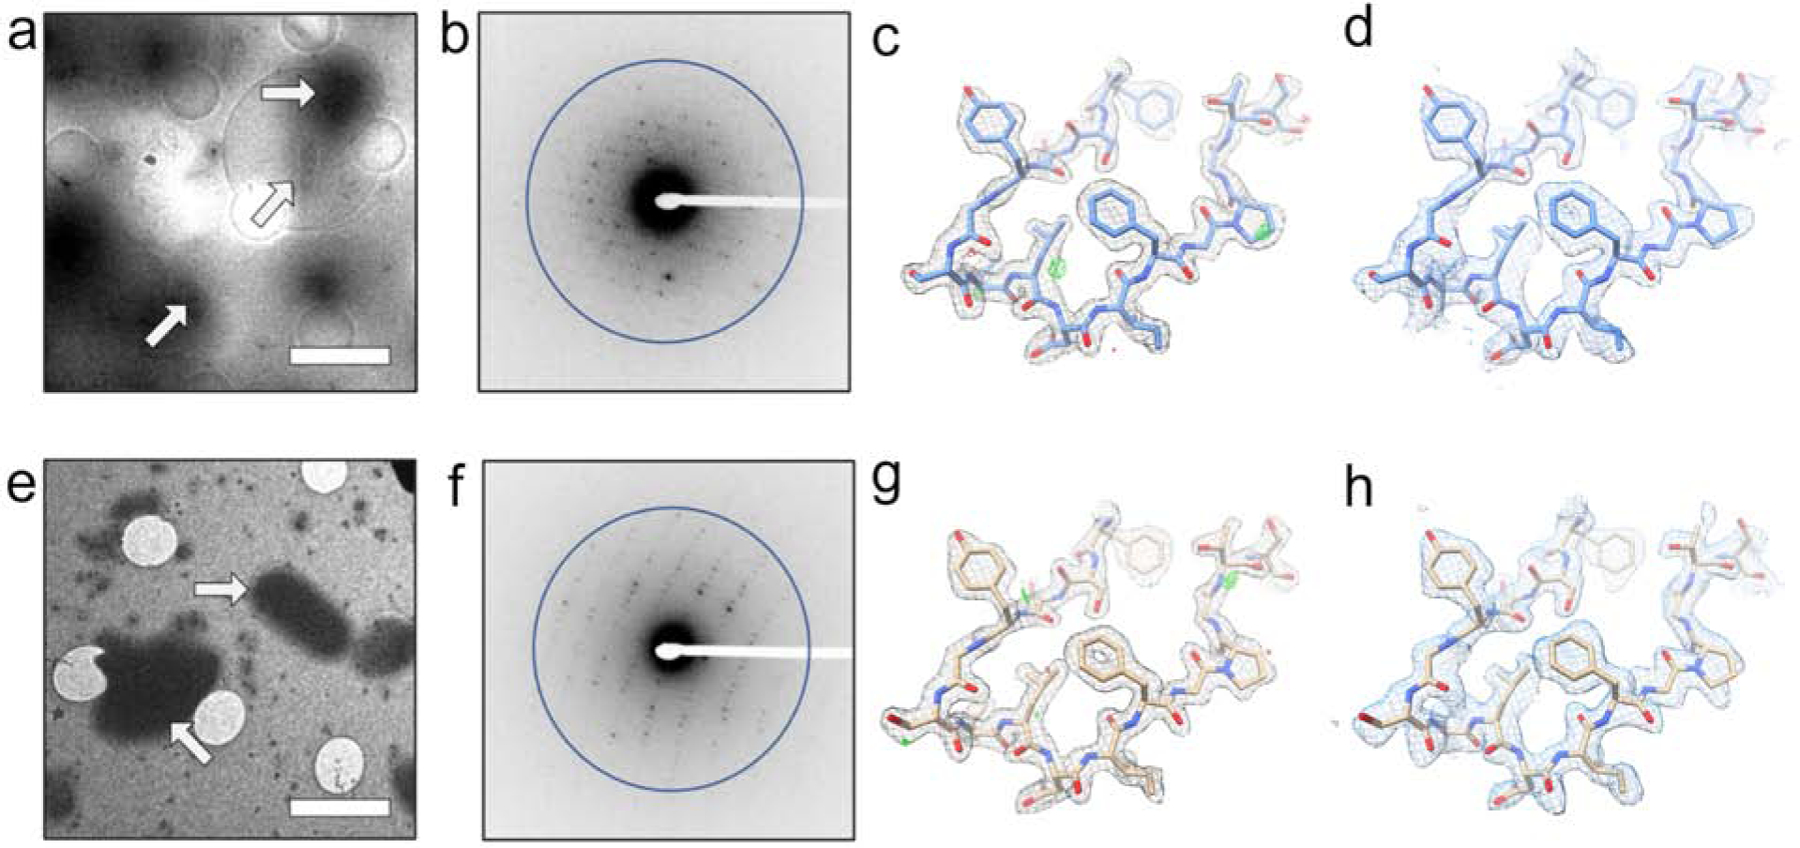
Both MPD treated samples (a-d) and lipase treated samples (e-h) produced grids where crystals could be identified in the cryo-TEM (a - MPD and e - lipase). MicroED data collection (representative diffraction patterns with resolution ring of 2.0 Å shown as b-MPD and f-lipase) on these crystals from both treatments produced structures at 2.0 Å. The 2Fo-Fc maps (c – MPD and g – lipase) and composite omit maps (d – MPD and h – lipase) show clear density surrounding the models. Scale bars in a and e represent 4 μm. The density maps in c and g and composite omit maps in d and h are contoured at 1.5σ and 1.0σ, respectively. The 2Fo-Fc map in c and g is contoured at 3.0σ (green) and −3.0σ (red).