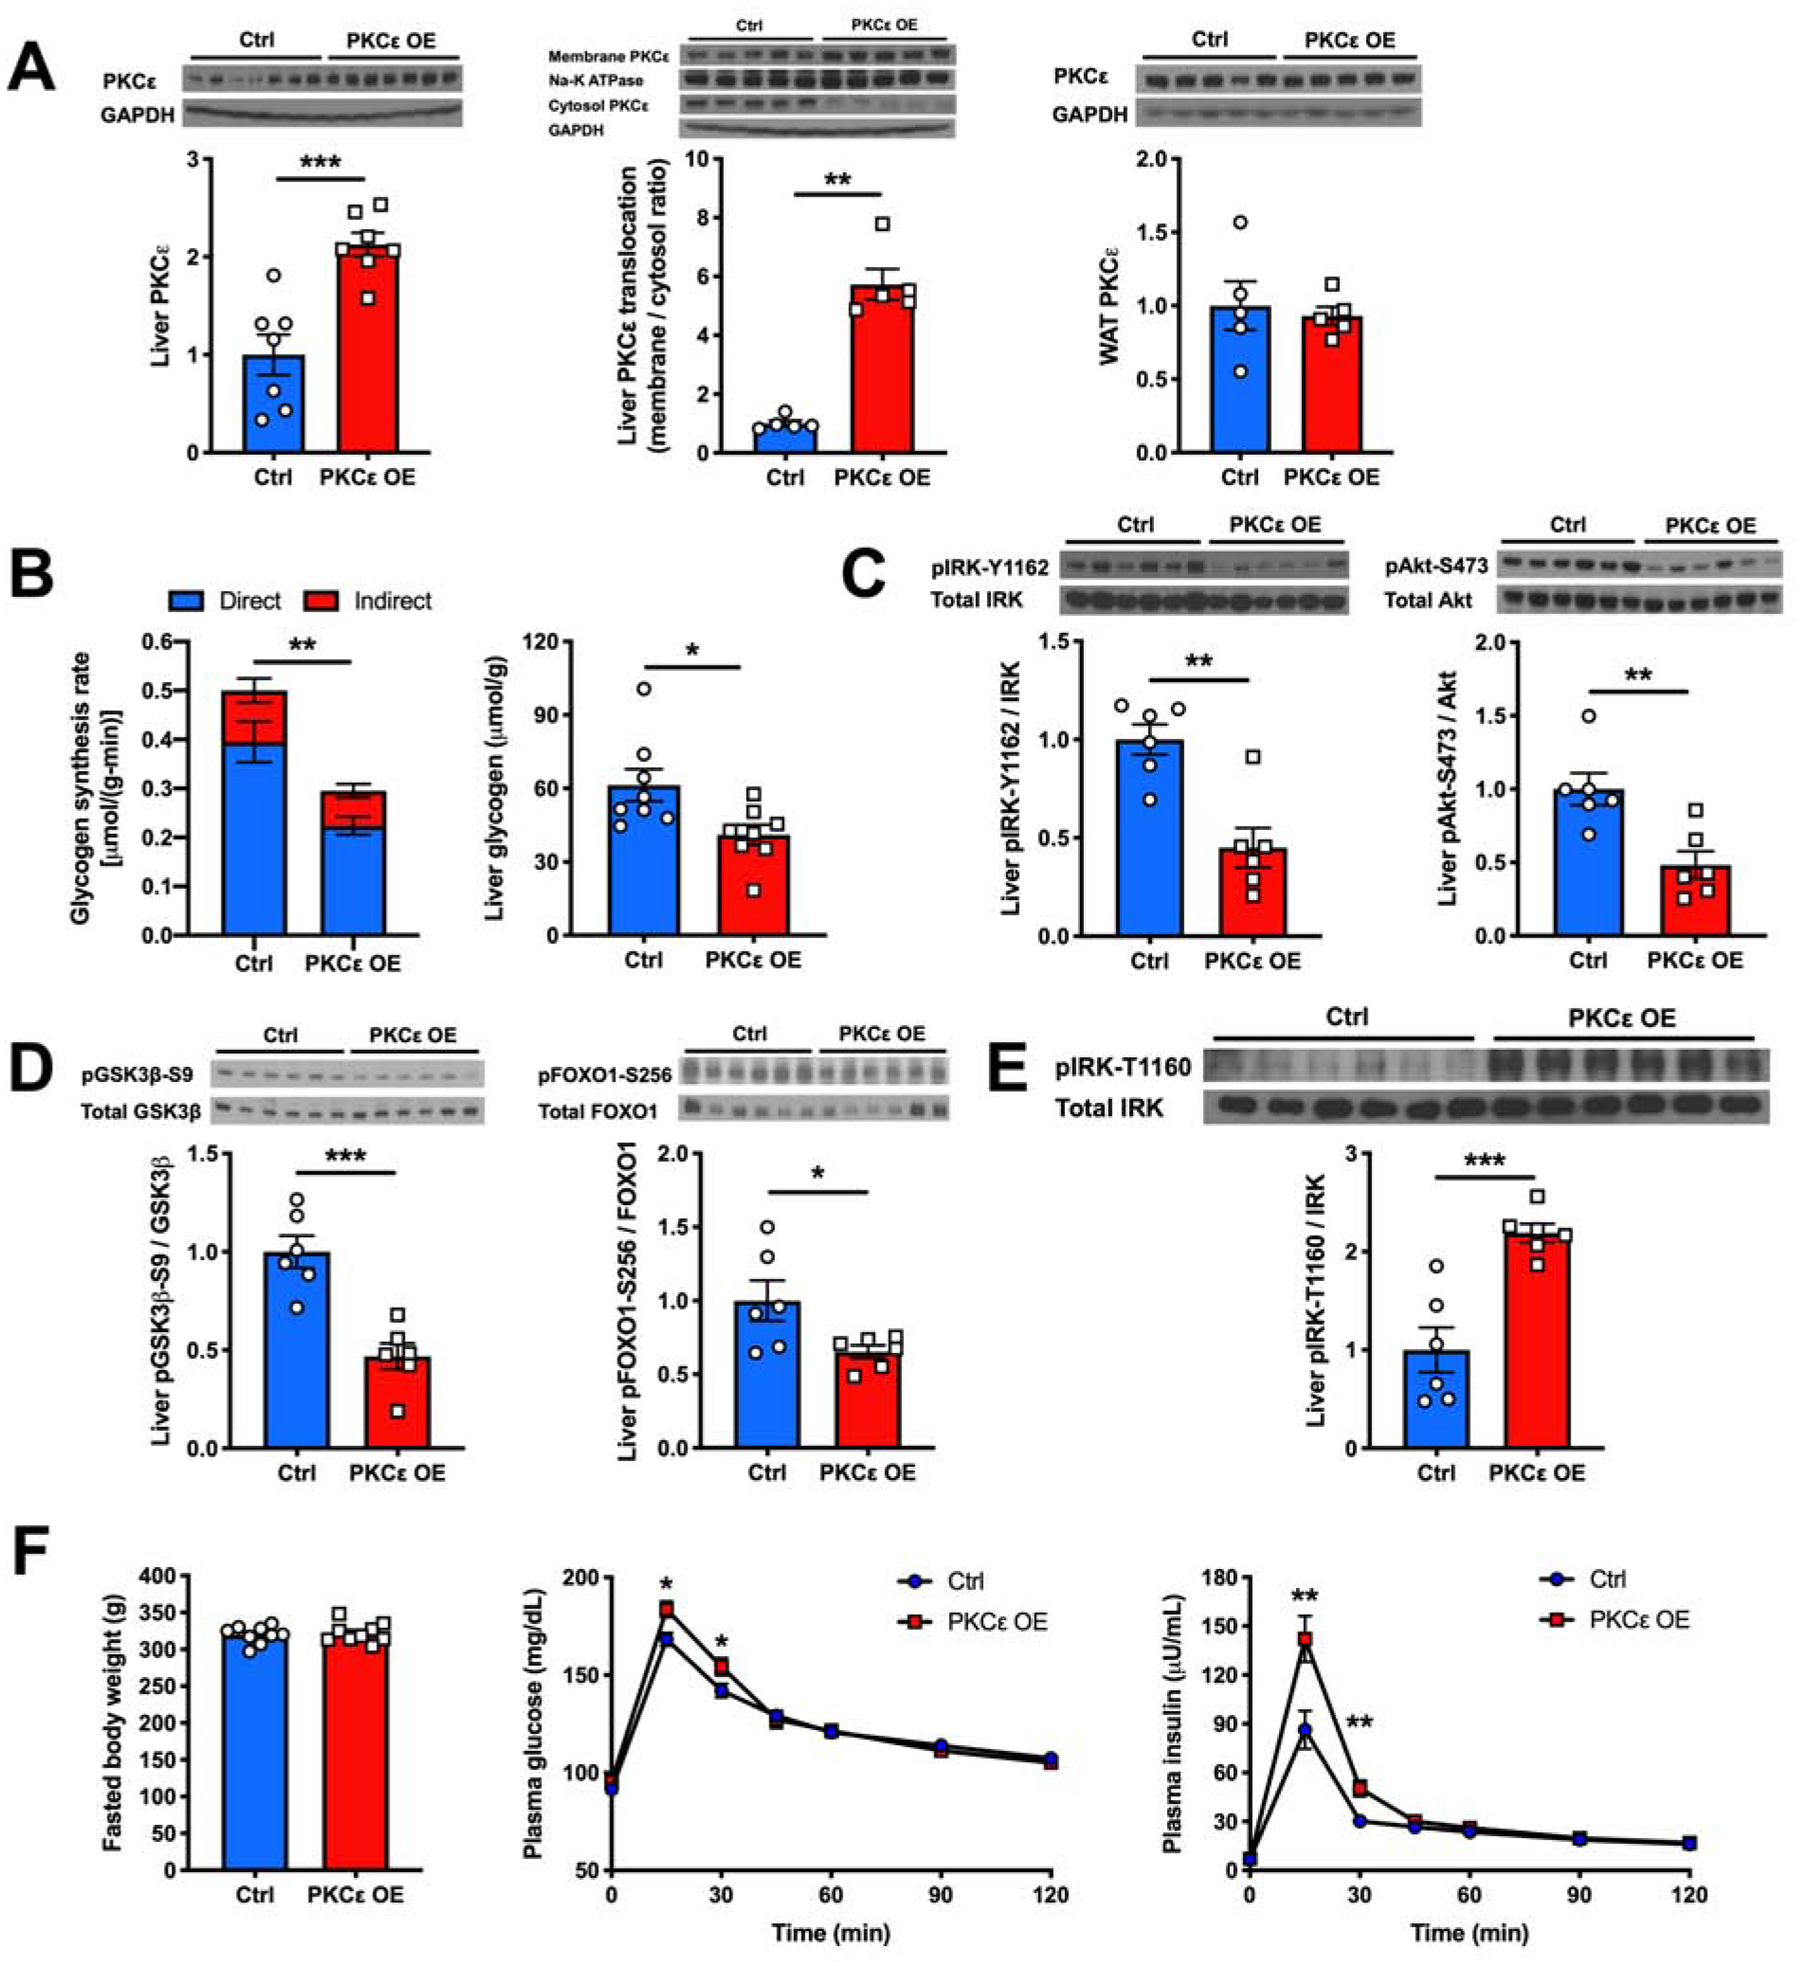
Figure 4. Liver-Specific OE of Constitutively Active PKCε Induces HIR.

(A) Hepatic PKCε protein content, hepatic PKCε translocation from cytosol to membrane and WAT PKCε content measured by western blot (top) and its quantification (bottom).
(B) Hepatic glycogen synthesis rate during a hyperinsulinemic-hyperglycemic clamp and post-clamp liver glycogen content in Ctrl vs hepatic PKCε OE rats.
(C) and (D) Levels of insulin-stimulated liver pIRK-Y1162, pAkt-S473, pGSK3β-S9 and pFOXO1-S256 as measured by western blot (top) and with its quantification (bottom).
(E) Levels of liver pIRK-T1160 as measured by western blot (top) and with its quantification (bottom).
(F) Fasted body weight, plasma glucose and insulin levels during an oGTT in Ctrl vs hepatic PKCε OE rats.
In all panels, data are the mean±S.E.M. In (A), n = 5 or 7 per group. In (B), n = 8 per group. In (C), (D) and (E), n = 6 per group. In (F), n = 9 per group. *P < 0.05, **P < 0.01 and ***P < 0.001.
