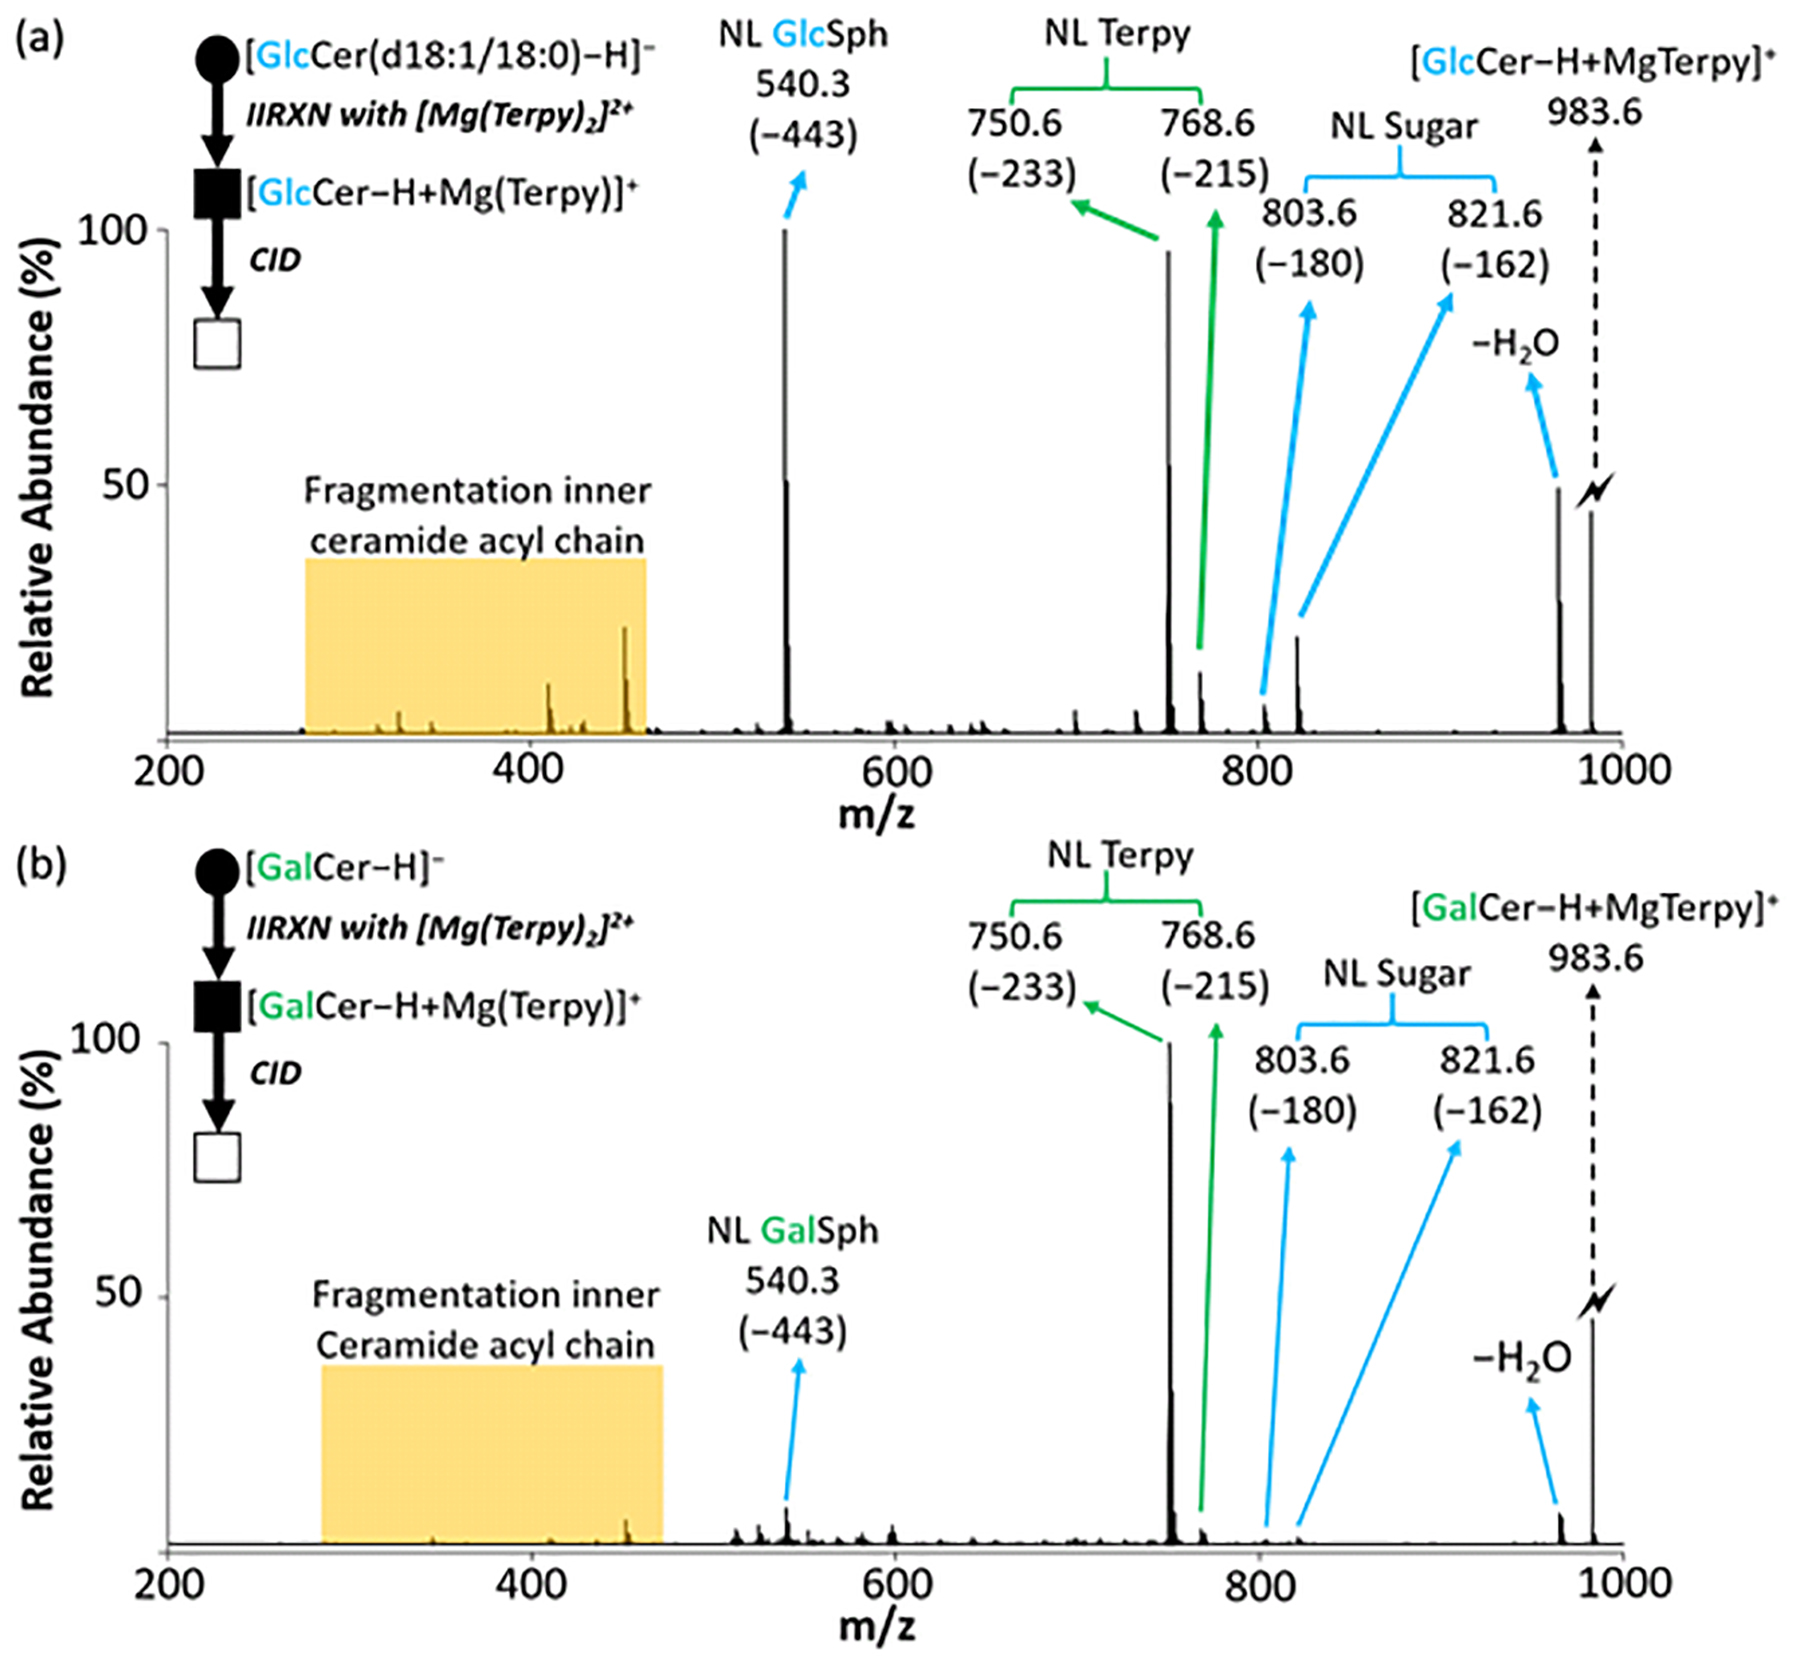
Figure 3.

The comparison of the CID spectra between cerebrosides after gas-phase ion/ion reaction. (a) The CID spectrum of the [GlcCer(d18:1/18:0) – H + MgTerpy]+ complex (m/z 983.6) generated via gas-phase ion/ion reaction between singly deprotonated GlcCer anion and [Mg(Terpy)2]2+. (b) The CID spectrum of the [GalCer(d18:1/18:0) – H + MgTerpy]+ complex (m/z 983.6) generated via gas-phase ion/ion reaction between singly deprotonated GalCer anion and [Mg(Terpy)2]2+. The values inside the parenthesis indicate the neutral loss. The lightning bolt (⚡) signifies collisionally activated precursor ion. The solid circle (●) indicates the mass selection in the negative ion mode analysis and the black and white squares (■/□) indicate the positive ion mode analysis with and without mass selection, respectively.
