
Figure 1. General methodology and flux analysis.
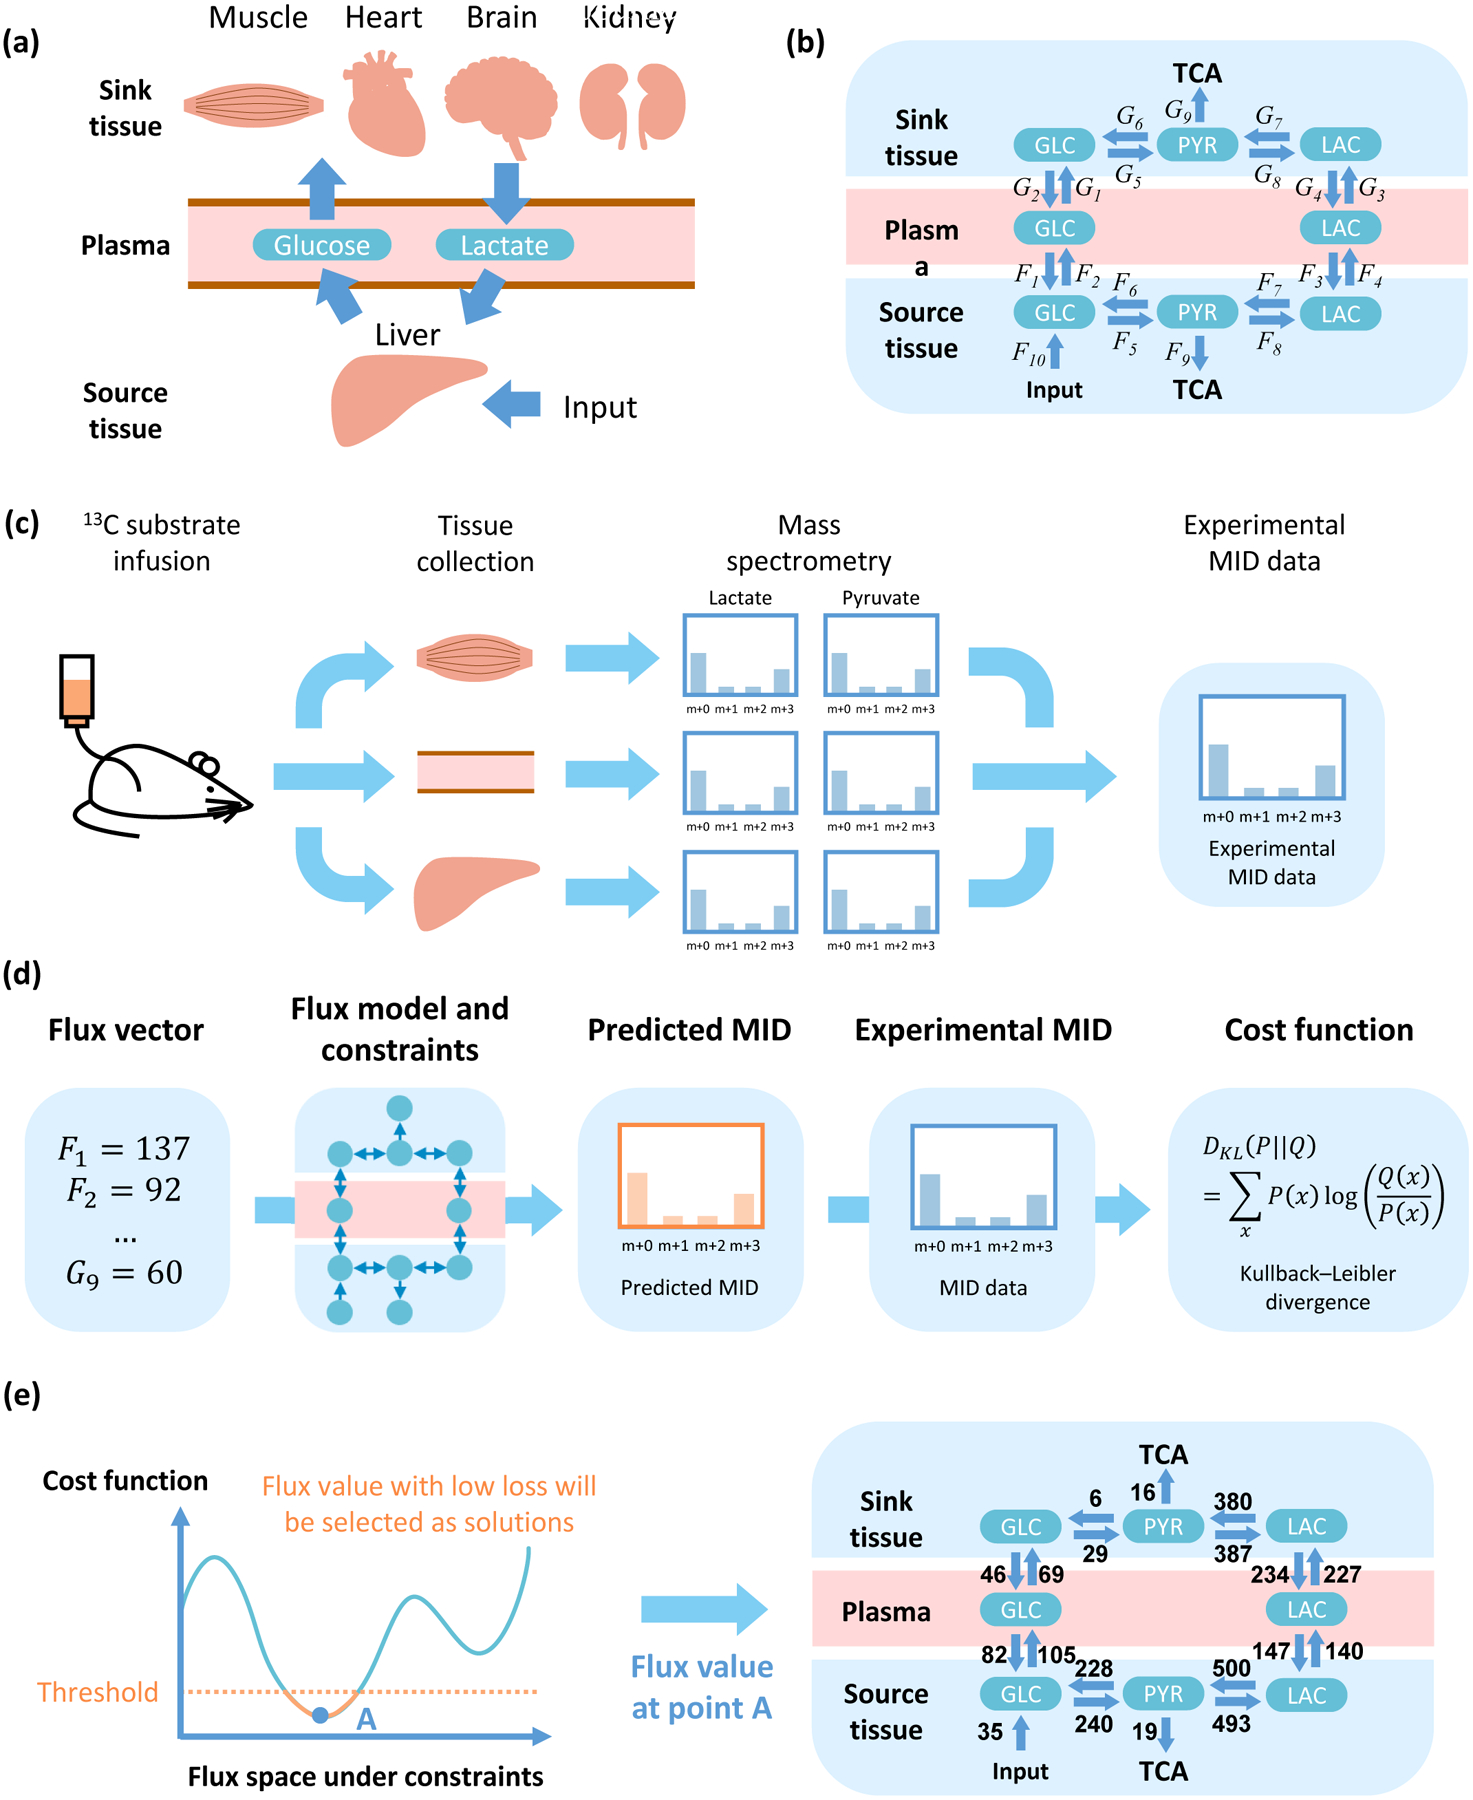
(a) Diagram of metabolite exchange between source and sink tissues. Glycogen, amino acids and other nutrition source are utilized to supplement glucose in the source tissue. (b) Three components (source tissue, plasma and sink tissue) and two circulating metabolites (lactate and glucose). (c) Data acquisition. Tissues of 13C-infused mice are extracted and analyzed by mass spectrometry. Distribution of mass isotopomers for metabolites, such as glucose, lactate and pyruvate, are used to solve for the fluxes (b). (d) Definition of cost function. The flux vector is used to predict MID of target metabolites, and compared with experimental MID to calculate cost function. (e) Schematic and example of a feasible solution. The solution with cost function lower than a threshold is considered as feasible solution and will be utilized in the following analysis.