
Figure 2. Contribution to the TCA cycle from circulating glucose.
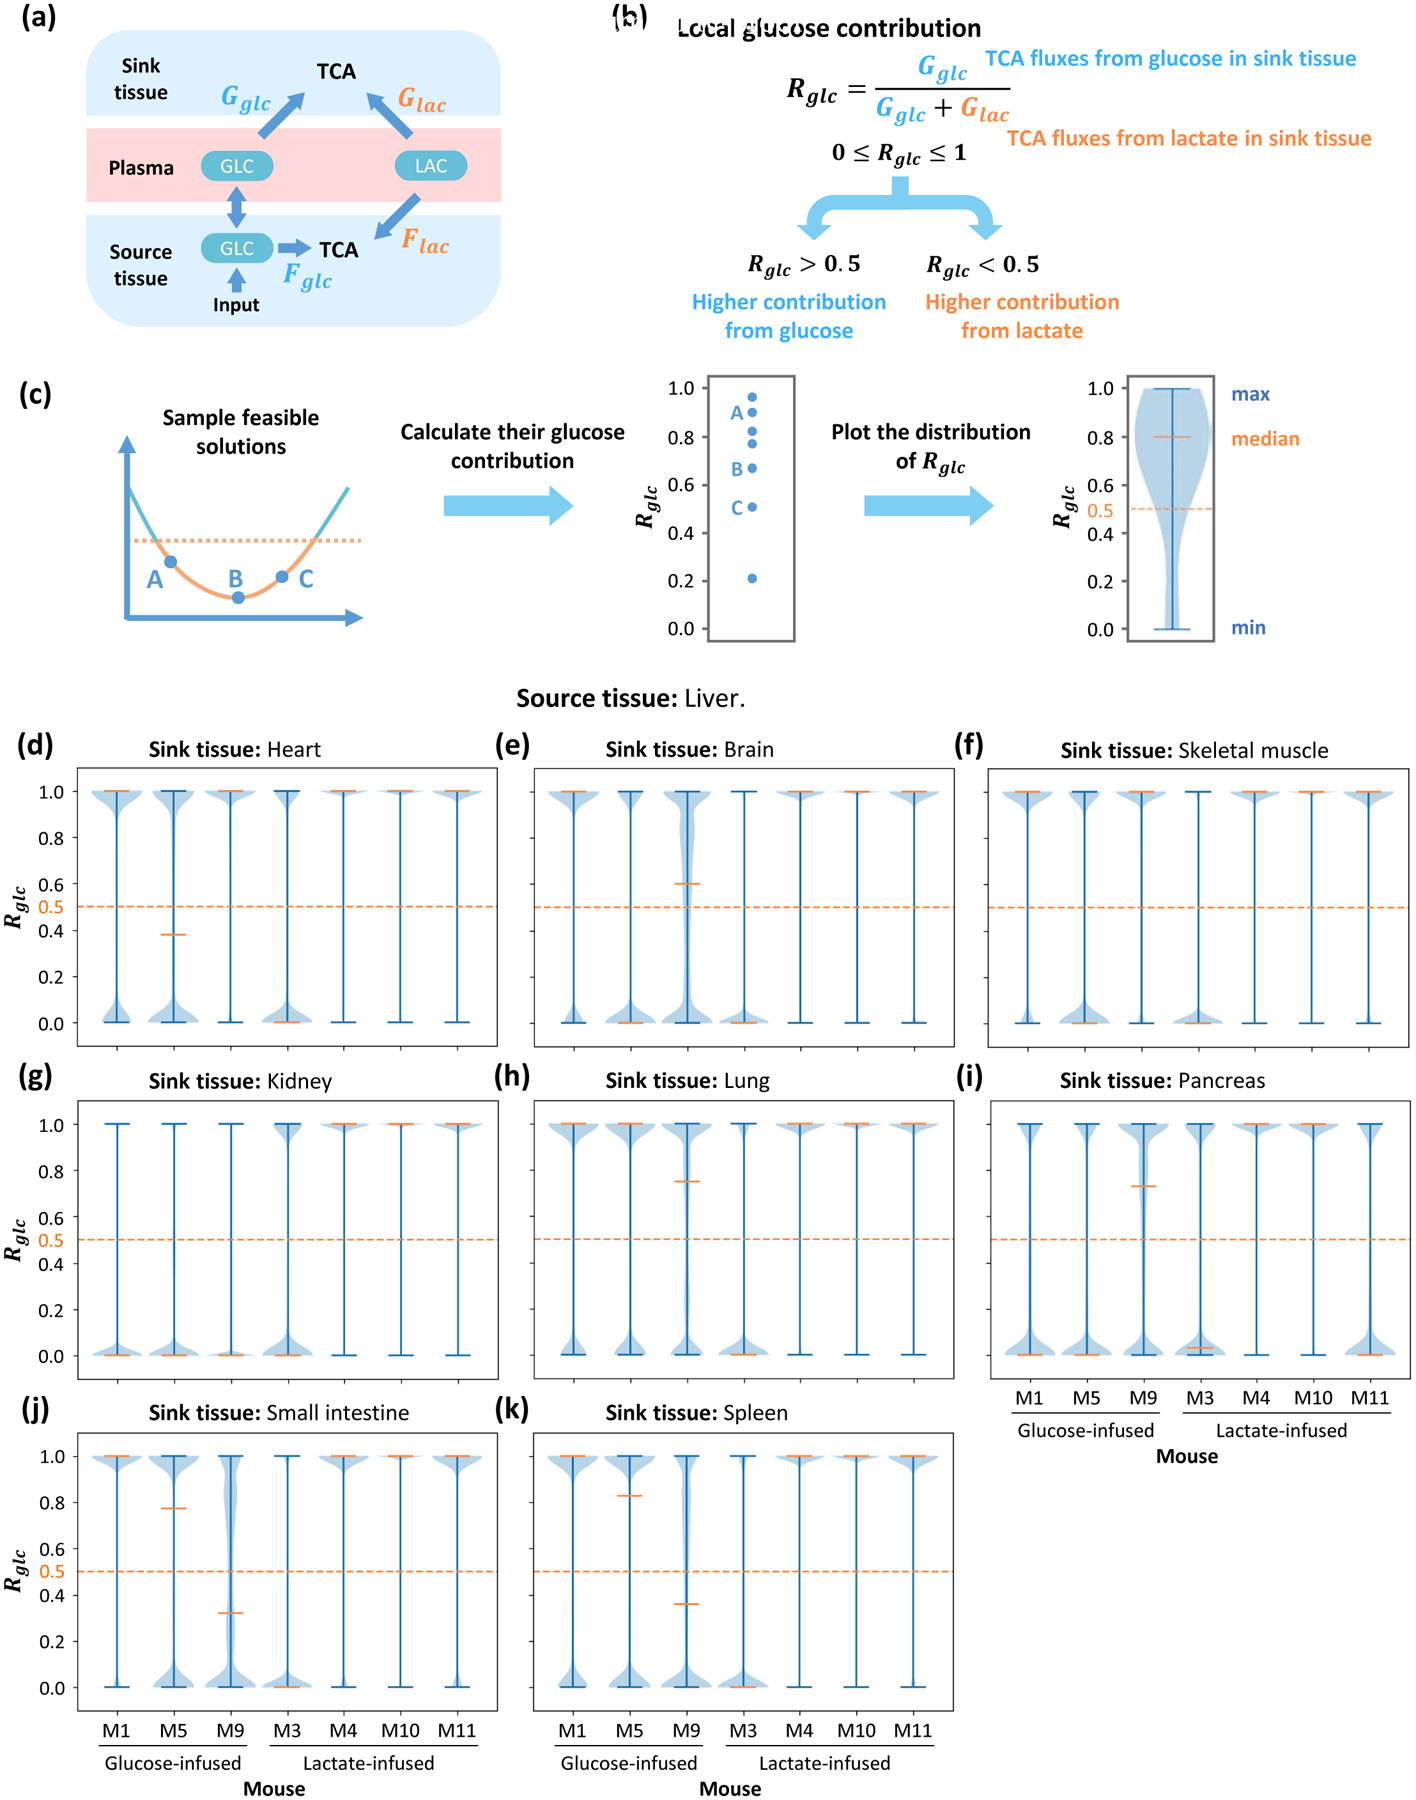
(a) Diagram of contribution fluxes. Glucose and lactate contribute to the TCA cycle by Fglc and Flac in the source tissue, while Gglc and Glac are related to the sink tissue. The direction of net flux between circulating glucose and glucose in source tissue is variable in different solutions. (b) Definition of global glucose contribution ratio Rglc based on fluxes in (a). The global glucose contribution Rglc is defined as the relative ratio of glucose contribution flux to total contribution flux in sink tissue. Rglc is a scalar between 0 and 1, and higher Rglc represents higher glucose contribution to the TCA cycle. (c) Procedure to compute distribution of glucose contribution. Feasible solutions are sampled and glucose contribution ratios are calculated. The distribution of glucose contribution is displayed by a violin plot. (d-k) Distribution of local glucose contribution based on models with different sink tissues. For each sink tissue, the source tissue is liver, and contribution ratio is calculated from data in 7 different mice. For most kinds of sink tissue, the median of glucose contribution is higher than 0.5 in most mice, which means glucose contributes more than lactate to the TCA cycle. The orange dash line represents 0.5 threshold. Data set is from glucose-infused mice (M1, M5, M9) and lactate-infused mice (M3, M4, M10, M11) in Hui et al, 2017.